
Anthony Licciardello | May 5, 2026
Home Values
By Anthony Licciardello, The Prodigy Team — NYS/NJ Licensed Broker · Westfield, NJ
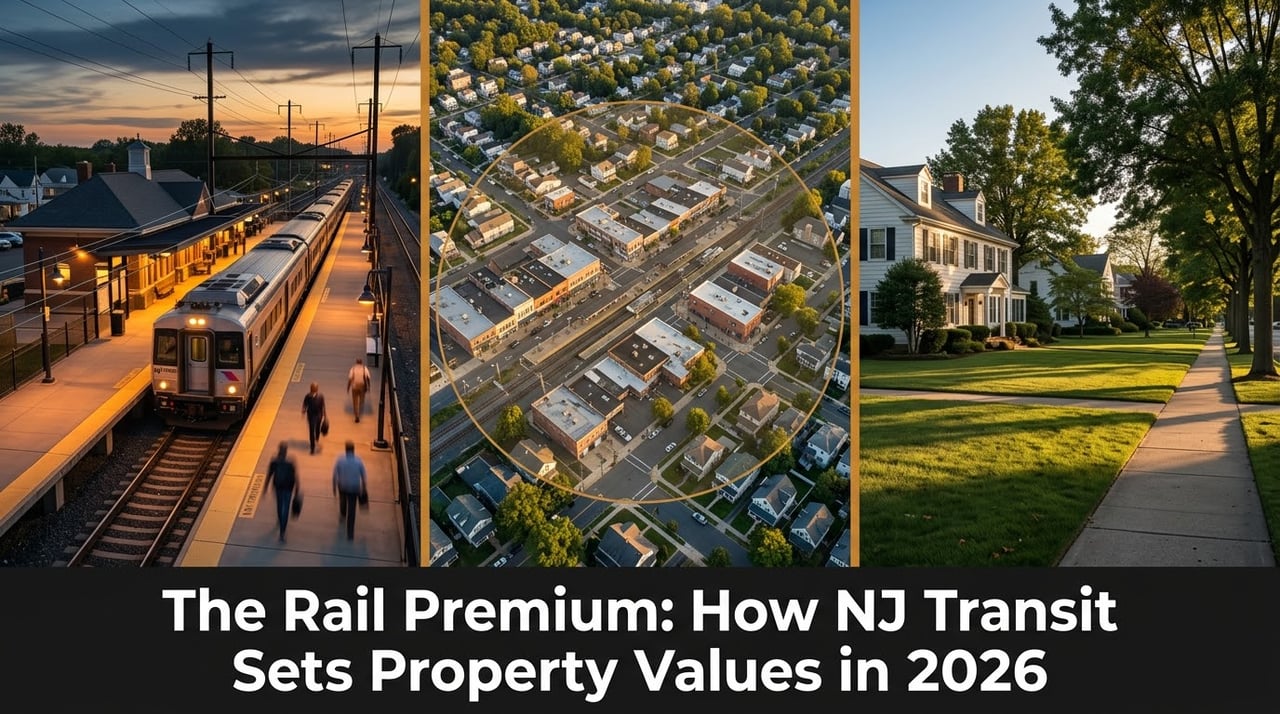
In Westfield, New Jersey, the most valuable square foot of land isn't on a one-acre lot in Wychwood Manor or behind a wrought-iron gate in Indian Forest. It's the patch of asphalt directly outside the NJ Transit station — and every home within a half-mile walk of it.
Regional data on New Jersey transit-oriented housing puts the absolute premium for homes within a half-mile of a station at roughly $34,000 over comparable homes two miles out. In Westfield specifically, that translates into something more important than a single dollar figure: it's the reason the dense grid streets near the historic core consistently outperform on price-per-square-foot, even when their lots are a third the size of homes farther from downtown. And it's about to be reshaped by the largest downtown redevelopment project in the town's modern history — One Westfield Place.
Westfield was incorporated in 1798, but the town as it exists today was built by the railroad. The Central Railroad of New Jersey reached Westfield in the late nineteenth century, and within a generation the entire street pattern of the historic core had reorganized itself around the station. Tight grid blocks. Narrow lots. Houses built close enough to walk briskly to the platform with a leather briefcase and a folded copy of the morning paper. That layout still exists, almost unchanged, more than a century later.
Today, the Westfield train station sits on NJ Transit's Raritan Valley Line, with service to New York Penn Station via a transfer at Newark Penn. Peak commute time runs roughly 55 to 70 minutes door-to-door for Manhattan workers — competitive with nearly any commuter town within sixty miles of the city. Monthly passes run approximately $220–$250. Off-peak service offers occasional one-seat rides; peak service requires the Newark transfer that has become a non-issue for the regulars who do it five days a week.
The economic implication is the central fact of Westfield real estate: every home in the town has an implicit relationship to the train station. The closer you are, the more that relationship is worth.
Statistical analysis of NJ Transit communities consistently identifies a measurable price premium for homes within walking distance of a station. The headline figure for the half-mile radius is approximately $34,000 in absolute premium over comparable homes located further out — narrowing to roughly $23,000 at the two-mile threshold, and converging toward zero beyond that. Regional data also documents 2.3% to 7.5% additional appreciation for transit-proximate homes over multi-year periods.
In Westfield's current 2026 market — where the median sold price sits near $1.15 million, price per square foot is approximately $468 (up 4.92% year-over-year), and inventory is functionally tight at 0.91 months of supply with homes selling at 4.22% over asking on average — the walk-to-train premium expresses itself most visibly through price-per-square-foot rather than total sale price. A 2,000-square-foot home three blocks from the station and a 3,200-square-foot home a mile away can clear at similar absolute prices. The smaller home is being valued differently, and the difference is the train.
For broader market context — sale-to-list ratios, days on market, recent appreciation — see our 2026 Westfield real estate update.
Standing on the platform at Westfield station, draw four concentric rings outward. Each ring is a different version of the town.
The transition between Ring 2 and Ring 3 — the line at one mile from the station — is where the experience of Westfield changes most sharply. Inside that line, you live a downtown-walkable life. Outside it, you live a car-suburban life. The price data reflects that.
For the deep-dive on the estate end of the spectrum, see our Wychwood Manor buyer's guide. For the technical breakdown of how RS-zoning shapes density across these rings, see our Westfield zoning map explainer.
The Town of Westfield approved One Westfield Place — the largest downtown redevelopment project in the town's modern history — with the amended redevelopment plan adopted in May 2025. The project covers parcels immediately surrounding the train station and will deliver three things that, taken together, materially change the math of the walk-to-train premium.
Most coverage of One Westfield Place focuses on the residential and retail components — the visible additions to the streetscape. But the contrarian read on this project is that the parking is the part nobody is talking about, and it's the part that will most directly affect home values.
The parking is the part nobody talks about — and it's the part that's about to change everything.
Here's the mechanism. Westfield has long had more commuters than parking spaces at and near the station. The waiting list for permitted spots can run years. That shortage has functioned as a silent constraint on the walk-to-train premium for homes between roughly 0.75 and 2 miles from the station — because buyers in that band can't actually drive to the station and reliably park. They have to walk, bike, or get a ride. For many commuters, that limitation pushes them inside the half-mile ring or out of Westfield entirely.
When 364 new parking spaces come online, the effective walking radius of the train station expands. Homes that were once "too far to walk reliably and impossible to park near" become workable commuter properties. The premium for the inside ring may compress slightly relative to the second ring as parking constraints loosen. Buyers in the 0.75-to-1.5-mile band are likely the largest beneficiaries.
The retail and office components matter for a different reason. They strengthen the downtown's daytime economy, which feeds the walkable-lifestyle premium that exists independently of the train (covered below). And the 205 new residential units (172 market-rate, 33 affordable) add a small but meaningful supply of rental inventory at the station — most of which will be rental, not directly competing with single-family stock.
Five neighborhoods sit close enough to the project that their values will move in some way as it delivers. Here is the street-level read.
For the canonical guide to all Westfield neighborhoods and how they fit into the broader pricing hierarchy, see our Westfield neighborhood guide.
Not every buyer paying the walk-to-train premium is actually riding the train. A meaningful and growing percentage of Westfield's downtown buyers are remote workers, hybrid professionals, retirees, or NYC transplants who simply value the walkability for its own sake.
Westfield's downtown supports that premium because of what's actually there: a nationally recognized commercial district along East Broad Street, the Saturday farmer's market, the AMC Westfield 7 cinema, Mindowaskin Park, summer concerts on the green, and a deep restaurant ecosystem that includes everything from white-tablecloth Italian at Mojave Grille to weeknight pizza at Joe's. For buyers comparing Westfield to its peer towns, this density of walkable amenities is what separates it from places like Chatham or Madison that have strong train service but thinner downtowns.
The implication for valuation is important: even when remote work expanded after 2020 and many predicted suburban-train towns would lose their premium, Westfield's downtown-walkable inventory held its pricing. The premium had decoupled from the train. One Westfield Place will reinforce that decoupling.
Westfield is one of three towns most often referenced together for the walk-to-train premium discussion in central and northern New Jersey: Summit, Millburn, and Westfield. Here's the side-by-side.
Town | NJT Line | Median Sold | Premium Profile |
|---|---|---|---|
Westfield | Raritan Valley | ~$1.15M | ~$34K · 2.3–7.5% appreciation uplift |
Summit | Morris & Essex / Gladstone | ~$1.9–2.0M | Higher absolute · similar % range |
Millburn / Short Hills | Morris & Essex (Direct) | ~$2.5–3M+ | Highest absolute · direct-train advantage |
The takeaway: the walk-to-train premium expressed as a percentage is broadly similar across the three towns. The difference is the absolute price level. Westfield's median sold sits roughly $700,000–$800,000 below Summit and more than a million below Millburn. For buyers who want the walk-to-train benefit at a more accessible entry point — and who can accept the Newark transfer for peak service — Westfield is the value play in the triangle.
The walk-to-train premium is one of the most economically significant features of the Westfield market — and one of the most poorly understood. Buyers routinely overpay for homes outside the effective walking radius assuming they're getting transit value, and sellers routinely under-price homes that should command premium positioning because of their proximity to the station.
Prodigy Real Estate operates across New York and New Jersey with deep expertise in Union County and the Westfield market specifically. Whether you're evaluating a half-mile-radius Colonial, a Gardens Tudor, or a second-ring property positioned to benefit from One Westfield Place, reach out — we'll walk through the actual pricing implications for your specific block.
Related reading: What it really costs to sell a home in Westfield NJ.
Prodigy Real Estate is an innovative real estate company offering high-end video production, home valuation services, purchasing, and home sales. Serving New York and New Jersey.