
Anthony Licciardello | April 17, 2026
Long Beach Island
Most coastal markets softened in 2024 and 2025. Rising mortgage rates, stretched affordability, and cautious buyers worked against sellers in markets across the Jersey Shore and beyond. Long Beach Island moved in the opposite direction. Average single-family prices have climbed every year since 2019. Transaction volume has dropped sharply — not because demand weakened, but because there are not enough homes to buy. Heading into the spring of 2026, the Long Beach Island real estate market is holding above $2.4 million on average, and the structural reasons behind that number are not going away.
Three forces drive this market. None of them are cyclical. First, the island's geography is fixed. Eighteen miles of barrier island flanked by the Atlantic and Barnegat Bay means no room for sprawl, no peripheral land to develop, and no supply-side pressure valve. New inventory enters the market almost exclusively when older homes are demolished and rebuilt. Second, a significant share of LBI homeowners locked in mortgages at sub-3% rates during the pandemic era. Selling now means surrendering that liability and stepping into financing at dramatically higher rates. Most are choosing to hold. Active inventory on LBI averaged around 100 listings throughout all of 2025 — a number so low it virtually guaranteed pricing support regardless of what the national market was doing.
Third, the buyer profile has shifted. What was once a regional drive-to vacation market serving affluent New Jersey and Philadelphia families has expanded. High-net-worth buyers migrating out of New York City, Los Angeles, and high-tax primary markets are identifying LBI as a destination for capital deployment. The normalization of remote and hybrid work has added another layer: properties that once sat empty from Labor Day to Memorial Day are now occupied year-round. When buyers view a home as a primary residence rather than a seasonal retreat, their willingness to absorb the acquisition cost expands considerably.
Market Data
The table below tracks single-family home sales on Long Beach Island from 2019 through 2025. The story it tells is direct: volume dropped by more than 40% while average prices more than doubled. That divergence is not a paradox — it is what happens when demand stays elevated and supply keeps contracting.
| Year | Units Sold | Avg Sale Price | Median Sale Price | Avg DOM | Sale / List |
|---|---|---|---|---|---|
| 2019 | 496 | $1,159,300 | $930,000 | 102 | 95.9% |
| 2020 | 720 | $1,322,376 | $1,100,000 | 109 | 97.2% |
| 2021 | 530 | $1,587,337 | $1,375,000 | 49 | 100.0% |
| 2022 | 350 | $1,922,759 | $1,725,000 | 53 | 98.6% |
| 2023 | 321 | $2,075,672 | $1,875,000 | 65 | 96.5% |
| 2024 | 330 | $2,313,636 | $2,050,000 | 72 | 97.0% |
| 2025 | 290* | $2.4M+* | $2,250,000 | 64 | 97.8% |
*2025 single-family unit count and average price range sourced from LBI local MLS aggregated data and end-of-year brokerage reports. Average price reflects approximately 6.5% growth over 2024; exact figure varies by data provider methodology.
Between 2019 and 2025, single-family sales volume fell from 496 units to 290 — a contraction exceeding 41%. During that same window, the average sale price climbed from $1.16 million to north of $2.4 million. That is more than 100% appreciation in six years. The 2021 peak — when homes sold at 100% of list price in an average of 49 days — reflected pure pandemic frenzy. The more measured 6.5% growth rate recorded in 2025 is actually a healthier indicator. It signals a maturing luxury market finding its floor rather than a market losing altitude. The 97.8% sale-to-list ratio that closed out the year tells you sellers were not capitulating. Buyers were meeting asking prices across the island.
Q1 2026 — January
January is typically the quietest month in any shore real estate market. Not this past year. Long Beach Island recorded 24 closed single-family home sales in January 2026, spanning municipalities from Surf City and Beach Haven to Harvey Cedars, Loveladies, and Holgate. The average sale price came in just above $2.43 million. The median was $2.30 million. Transaction prices ranged from $965,000 at the entry end up to $4.75 million at the top of the range — a nearly $4 million spread within a single winter month.
That spread tells you something important about how LBI functions. This is not a monolithic market where every sale looks alike. Location, proximity to the ocean, lot size, and construction vintage produce massive valuation differences even within a small geographic footprint. But January confirmed the broader point: high-net-worth buyers are not seasonal in their decision-making. When the right property appears at the right price, they act — in January, in February, in any month the opportunity presents itself.
Q1 2026 — February
February 2026 stands as one of the slowest Februarys in LBI real estate history. Only 18 homes went under contract island-wide. Just 17 closed. By raw volume metrics, it looked like a frozen market. But the freeze had nothing to do with demand. Repeated severe winter storms, sustained ice, and some of the coldest temperatures the island had seen in decades physically blocked buyers from touring properties and pushed sellers to delay listings until conditions improved. This was a logistics disruption, not a market signal.
The critical data point from February is what did not happen: prices did not fall. The median sale price for the homes that did close held at $2.0 million. The average came in at $1.91 million — a figure weighted toward smaller or less premium property types rather than any softening of underlying values. Homes that reached the closing table achieved a sale-to-list ratio near 97%, barely off the annual baseline. And 47 new listings still entered the market during the month. Motivated sellers were not waiting for spring. They were building a reservoir of inventory for the buyers who would come rushing in as soon as the weather broke.
Buyer Note
February's near-record quiet did not represent lost demand — it represented deferred demand. Every serious buyer who paused in February was still in the market come March. That compressed pent-up pressure into a shorter window, creating a faster-moving spring than most years produce on LBI.
Q1 2026 — March
March confirmed everything the January and February data suggested. As conditions normalized, buyers who had been sidelined came back decisively. Contract volume nearly doubled February's pace — 31 homes went under contract across the island. Sellers followed in force: 63 new listings hit the market in March, more than tripling February's new listing count and pushing total active inventory to 119 properties island-wide. That is the most selection buyers had seen in months. It still represents a historically thin market by any pre-pandemic measure.
Twenty-three homes closed in March. The average sale price was $2.28 million. The median came in at $2.20 million. Closings ranged from a $420,000 condo at the entry end to a $4.2 million waterfront estate at the top. That range, and those averages, confirm the market's pricing floor is firmly established. The weather disruption in February did not shake it. The spring acceleration in March validated it.
Market Dynamics
The most revealing number inside the March 2026 data is not the average sale price. It is the gap between the median and average days on market for closed transactions. Among homes that closed in March, the median days on market was 27. The average for those same closings was 51. When you look at all active listings — homes sitting without a contract — the average climbed above 90 days at an average asking price near $2.95 million. That is a spread of nearly $700,000 between what buyers are paying and what overpriced sellers are asking.
This divergence tells you exactly what kind of buyers are operating on LBI in 2026. They are educated, liquid, and disciplined. When a property is accurately priced against current comparable sales, situated in a desirable location, and presented in turnkey condition, those buyers move fast — sometimes within two weeks of the listing going live. But properties carrying aspirational pricing anchored to the 2021-2022 frenzy, or older structures requiring heavy renovation capital, are stagnating. They drag the average days on market upward and create a misleading narrative of a softening market.
The market is not soft. A segment of overpriced listings is soft. Sellers who understand that distinction are the ones closing quickly and at strong numbers. Those who don't are sitting on their asking prices watching inventory build around them.
Capital Structure
The Federal Reserve's rate cycle has reshaped affordability across most of the American housing market. On Long Beach Island, its influence is significantly muted. In the first quarter of 2026, 53% of all closed single-family sales on the island were all-cash transactions — 24 out of 45 closings. No mortgage. No rate sensitivity. No underwriting timeline. In the $2 million and above segment, cash was even more dominant.
The buyers operating at this tier are drawing on equity from primary home sales in high-cost markets, liquidating investment portfolios, or deploying capital into hard coastal assets without taking on debt. Many understand that if rates eventually drop, a cash-out refinance is always available. They are not waiting for that window to act. They are moving now, when supply is thin and competition among serious buyers remains real.
This cash dominance is the single most important structural insulator the LBI market has. A market where more than half of all transactions require no financing is a market that the Fed's rate decisions cannot pressure into price correction. This dynamic is visible across Jersey Shore luxury submarkets as well — the upper tier of Sea Girt real estate and the waterfront segment of Long Branch show similar cash-buyer patterns at the premium end, though neither approaches LBI's concentration at the $2 million-plus tier.
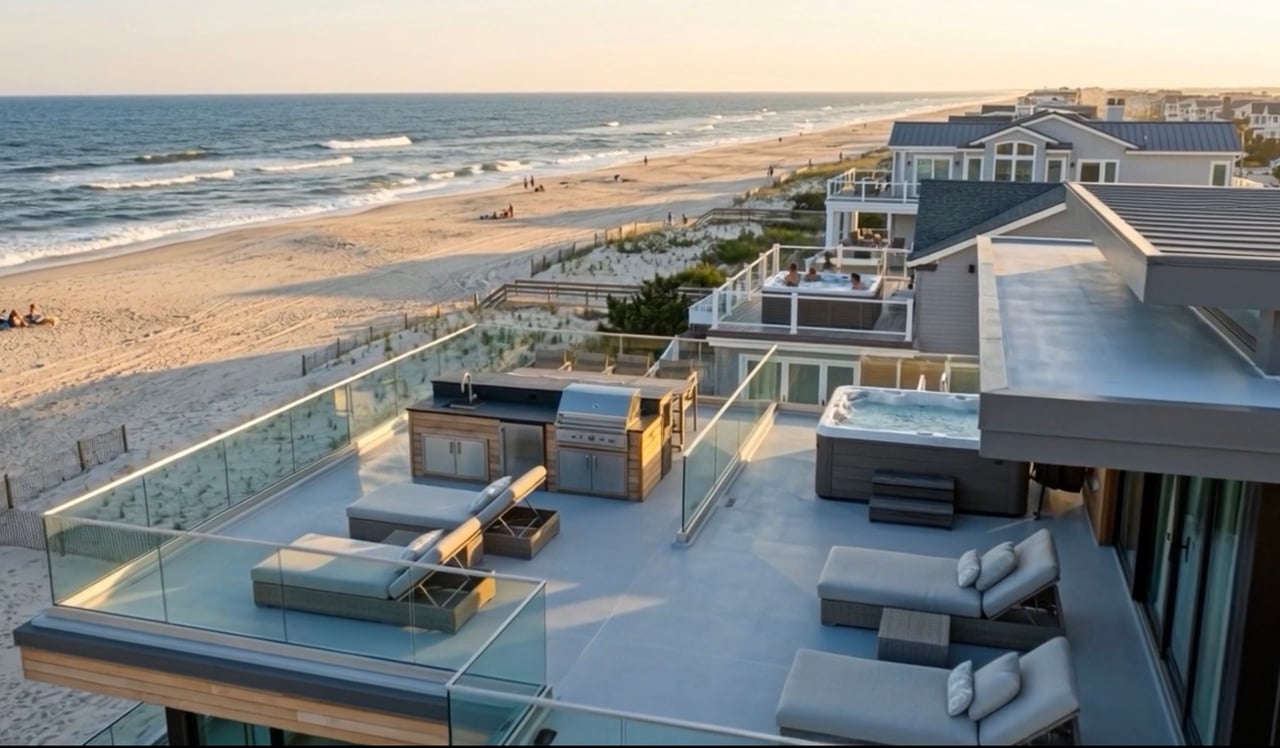
Video: Long Beach Township, LBI
New construction has reshaped the Long Beach Township real estate landscape — and it is driving the pricing premiums visible across all of LBI's Q1 2026 data.
Outlook
April and May are historically the strongest months to buy on Long Beach Island. Active inventory peaks during this window as sellers who held through winter bring homes to market ahead of the summer season. As of mid-April 2026, island-wide inventory is building toward the 120s — the most selection buyers will see all year. That window closes fast. Once the summer rental season opens in June, a significant share of unsold listings quietly disappear from MLS as owners shift their properties to rental income. Properties that were actively for sale in May can vanish from the market in a matter of weeks, replaced by rental agreements commanding $15,000 to $20,000 or more per week at peak.
This year, that dynamic is amplified. The weather-disrupted start to 2026 pushed a large volume of motivated buyers into the spring window simultaneously. Historically, March through May accounts for roughly 25% of LBI's annual sales volume. Given the delayed start, analysts and local brokerages project that share running meaningfully higher this spring — a compressed wave of qualified demand absorbing inventory faster than a normal year. For sellers, accurate pricing now produces better outcomes than extended market times stretching into summer. For buyers, the data does not support waiting for a price correction. The structural supply constraint that has held this market above $2 million for three consecutive years has not loosened.
Buyers moving to LBI from other NJ markets should also understand the regulatory and cost landscape specific to barrier island transactions. Recent rule changes affecting NJ shore real estate — including updates to CAFRA-related construction standards — affect how new builds are permitted and what buyers need to underwrite at acquisition. And a full purchase budget should account for what NJ closing costs actually look like in 2026 before numbers get locked in.
Buying or Selling on Long Beach Island?
Prodigy Real Estate actively works the LBI market. Whether you're buying your first shore home, selling before the summer rental season, or evaluating an investment property, contact Anthony directly.
Email Anthony — [email protected]Or call: (718) 873-7345
Common Questions
Q
What is the average home price on Long Beach Island in 2026?
The average single-family home price on Long Beach Island is holding above $2.4 million heading into spring 2026. In March 2026, the average closed sale price was approximately $2.28 million with a median of $2.20 million. January 2026 averaged above $2.43 million. Even during the off-season, LBI pricing has shown no meaningful downward movement from the levels established over the past three years.
Q
Is Long Beach Island real estate a good investment in 2026?
LBI continues to attract serious investors for structural reasons that do not cycle. There is no new land to develop at scale. The short-term rental market generates significant income during a compressed summer window, with oceanfront and oceanblock properties routinely commanding $15,000 or more per week at peak. The island's strict zoning limits hotel development and funnels virtually all tourist accommodations through the single-family rental market — providing a durable financial floor for buyers who underwrite acquisitions against documented rental history.
Q
Why did the LBI real estate market slow down in early 2026?
The slowdown in February 2026 was weather-driven, not demand-driven. Repeated winter storms physically limited buyer access to the island and pushed many sellers to delay listings until conditions improved. Despite the drop in contract activity, pricing held steady throughout the month with closed sales still achieving near-asking-price ratios. March confirmed the disruption was logistical — contract volume nearly doubled and new listings surged once weather normalized.
Q
How many LBI home sales are paid in cash?
In the first quarter of 2026, 53% of all closed single-family sales on Long Beach Island were all-cash — 24 out of 45 total closings. In the $2 million and above segment, cash was even more prevalent. This level of unleveraged buying activity insulates the LBI market from Federal Reserve rate decisions in a way that most housing markets cannot replicate, and it is one of the primary structural reasons pricing has held firm despite elevated mortgage rates nationally.
*Single-family market data sourced from LBI local MLS aggregated statistics. Q1 2026 pricing data from local brokerage closed-sale reports. 2025 annual figures from Sand Dollar Real Estate LBI Market Statistics end-of-year report and local MLS aggregated data; average price reflects approximately 6.5% growth over 2024 and varies slightly by data provider. Historical trend data from LBI Market Insights and local MLS sources. Cash buyer figures from local brokerage Q1 2026 transaction reports.
Prodigy Real Estate is an innovative real estate company offering high-end video production, home valuation services, purchasing, and home sales. Serving New York and New Jersey.