
Anthony Licciardello | May 26, 2026
Long Beach Island
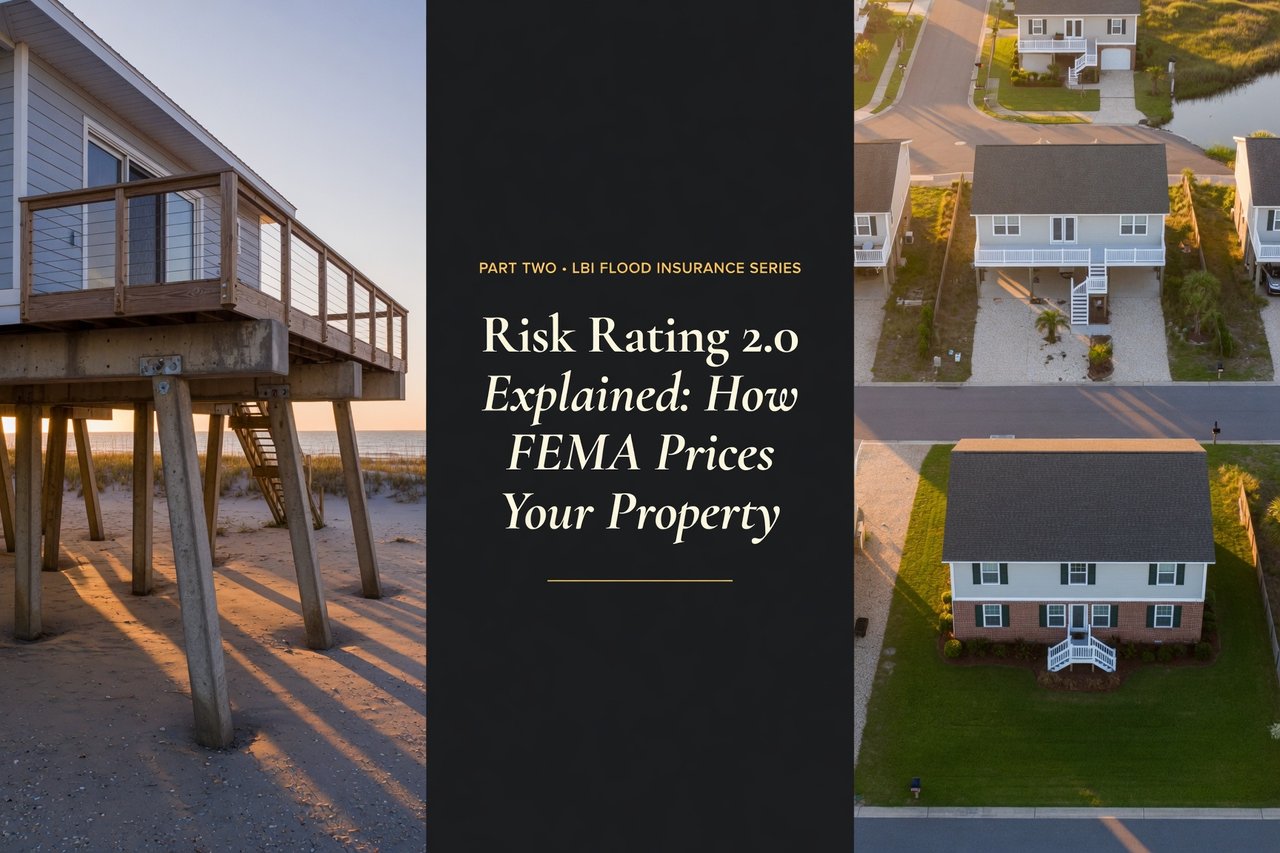
FEMA stopped pricing flood insurance by the polygon in 2021. The new methodology evaluates your specific house — and the variables it weighs hardest are not the ones most buyers expect.
Risk Rating 2.0 evaluates every property along three independent dimensions — the Where (location and hydrology), the How (building characteristics and elevation), and the What (replacement cost value). For LBI homes, the "How" category is the most actionable. First floor height, foundation type, flood vent installation, and mechanical equipment placement collectively account for the largest premium movement available to most owners. Understanding which variable in which pillar your home is failing on is the difference between paying $850 a year and paying $4,800.
For fifty years, FEMA priced flood insurance the way municipalities price garbage collection: by polygon. Your house fell inside a colored shape on a map, the polygon had a rate, and that rate was your rate. The system was administratively simple and statistically blunt — it treated a piling-elevated 2018 build and a slab-on-grade 1965 ranch as identical risks if they sat inside the same V-Zone boundary.
That system retired in 2021. The replacement, Risk Rating 2.0, prices each home individually using a multi-variable algorithm that incorporates federal hydrology data, granular elevation models, structural characteristics, and replacement cost economics. The shift was not cosmetic. For some LBI properties, the new methodology cut premiums in half. For others, it tripled them. This article explains the three pillars the algorithm weighs, which variables in each pillar are actionable, and where you should be focusing your attention if your premium is higher than you think it should be.
The legacy NFIP rating system in place from the 1970s through 2021 was designed around a small number of inputs: your flood zone designation, the year your home was built, and your elevation relative to Base Flood Elevation if you bothered to submit an Elevation Certificate. The system produced consistent prices, but consistency was bought at the cost of accuracy.
Inside any given zone, the rate sheet was the rate sheet. A 1,200-square-foot bungalow in Beach Haven and a 4,800-square-foot oceanfront contemporary in Loveladies might both sit in the same V-Zone polygon, generate the same per-square-foot rating, and produce vastly different financial exposures to FEMA if either home were destroyed. The contemporary represented a far larger potential claim, but the rate sheet did not see size.
Risk Rating 2.0 changed that on every dimension. The system now considers your home's distance from multiple water sources, its elevation calculated from federal LiDAR data, its specific foundation and construction type, the flood vents installed in its lower enclosure, the location of its mechanicals, and a current replacement cost estimate calibrated against actual claim economics. For a small minority of properties, the new algorithm produced cheaper premiums than the old one. For most LBI properties — particularly those that were under-rated by the old polygon system — premiums moved up.
If you came up in the old system and your renewal in 2026 looks unrecognizable compared to a decade ago, this is why. The methodology that priced your home in 2014 is no longer the methodology pricing your home now. FEMA documents the full transition in its Risk Rating 2.0 methodology overview.
The first pillar covers everything about where your home physically sits. This is the closest analog to the old zone-based system, but evaluated with substantially more precision. The algorithm pulls four key inputs:
Distance to water. Not just whether you're in a flood zone — but how far your specific structure sits from the Atlantic Ocean, Barnegat Bay, and any local inlets or tidal creeks. A home set back 600 feet from the ocean carries a different "Where" profile than one set back 80 feet, even if both are formally in a V-Zone.
Ground elevation. The elevation of the land itself, measured against surrounding terrain and against the elevation of the nearest water sources. On LBI, where the entire island sits within a narrow vertical band, even small variations in lot grade are statistically meaningful. The algorithm draws on federal LiDAR mapping data to assess this without requiring an owner-submitted survey.
Flood frequency modeling. Each parcel is evaluated against multiple types of flood risk simultaneously — coastal storm surge, riverine flooding (less relevant on LBI, but still modeled), rainfall-driven flooding, and tidal flooding. A property might face moderate risk on any single dimension but compound to a higher rated risk across all of them.
Local hydrology. Drainage patterns, proximity to wetlands and lagoons, distance to engineered shore protection (dunes, bulkheads, groins). Properties behind well-maintained dunes carry a different risk profile than those without dune protection, even at similar setbacks.
The "Where" pillar is largely fixed — you can't move the house, and you can't change the ocean — but it's not entirely outside your control. Properties behind town-maintained dune systems or municipal bulkhead programs benefit from those mitigations in the rating model. For property-specific zone data, the authoritative tool is the FEMA Map Service Center, with complementary state data available through the NJ DEP Bureau of Flood Engineering.
This is the pillar most owners can actually move. The "How" category evaluates how your specific structure is engineered to survive a flood — and unlike the "Where" pillar, almost every variable in it can be improved with construction. The four key inputs:
First-floor height (FFH). The single most heavily weighted variable in the entire Risk Rating 2.0 model. FFH measures the distance from the average grade beside your home to the surface of the first finished floor. Homes elevated even one foot above Base Flood Elevation (a unit of measurement FEMA calls "freeboard") can see premium reductions of up to roughly 30%. Three feet of freeboard produces materially larger reductions. Four feet maximizes most carriers' available discount.
Foundation type. Pilings score better than crawlspaces, which score better than concrete slabs. A piling foundation allows storm surge to pass underneath the structure without applying lateral pressure to the walls. A slab foundation puts every cubic foot of the first floor's contents into the surge path. Slab homes on LBI are rated meaningfully higher than otherwise-comparable elevated homes — which is a major reason most post-Sandy LBI rebuilds are on pilings rather than slabs.
Wall construction. Masonry and concrete block construction survives flood events better than traditional wood frame construction. The algorithm gives modest credit for masonry walls, particularly on the first occupied floor. For most LBI homes — which are predominantly wood frame to keep weight off pilings — this variable is fixed. For homes with masonry first floors above piling foundations (a common modern coastal design), the credit applies.
Engineered flood vents. If your home has any enclosed area below the flood level — a ground-level garage, an enclosed storage area, an enclosed crawlspace — FEMA requires engineered flood vents in those walls to relieve hydrostatic pressure during a flood event. The minimum is one square inch of vent opening per square foot of enclosed area, with vents on at least two different exterior walls. Homes with proper engineered vents score significantly better than homes with solid lower-enclosure walls.
A fifth, often-overlooked variable also lives in the "How" pillar: mechanical and electrical equipment (M&E) placement. Even a perfectly elevated home will be penalized if its HVAC condenser, water heater, electrical panel, and laundry units are sitting at ground level under the house. Lifting these onto an elevated platform, into an upper-floor utility closet, or into the attic moves them out of the algorithm's risk path. Part Four of this series details which retrofits in each of these categories produce the largest premium reductions.
The third pillar is the financial math FEMA does on the back end. It asks a different question than the other two: not how exposed your home is to flooding, but how much it would cost to make you whole if a flood destroyed it.
Replacement Cost Value (RCV). This is the algorithm's estimate of what it would cost, in current dollars, to rebuild your specific structure from scratch using comparable materials and finishes. A $2.4M oceanfront contemporary in Loveladies carries a higher RCV than an $850K bayside cottage in Beach Haven, and the algorithm scales the premium accordingly. Two homes with identical "Where" and "How" profiles can produce materially different premiums purely because one would cost twice as much to rebuild.
Coverage limit selection. The NFIP caps building coverage at $250,000 and contents coverage at $100,000 for residential properties. If your RCV exceeds those caps, you're effectively under-insured at the NFIP and would need either an excess flood policy or a private flood carrier to bridge the gap. Larger LBI properties — particularly oceanfront builds above $1M RCV — almost always require a private carrier for full coverage.
Deductible selection. Like every other line of insurance, higher deductibles produce lower annual premiums. Choosing a $10,000 deductible instead of a $1,250 deductible can meaningfully reduce your annual cost, with the trade-off that you are assuming more of the financial risk if a claim is filed. The right deductible is a function of liquidity and risk tolerance — not a universal answer.
The three pillars are not additive. They are multiplicative. A weakness on one pillar compounds with a weakness on another, which is why some LBI premiums are so much higher than the typical range. The table below shows how the same hypothetical home produces three different premium profiles depending on which pillars it's strong or weak on.
| Scenario | Where | How | What | Outcome |
|---|---|---|---|---|
| A — Oceanfront slab Old construction |
Weak | Weak | Avg | $4,700+ |
| B — Bayside elevated Modern build |
Avg | Strong | Avg | $1,200 |
| C — Oceanfront elevated Modern rebuild |
Weak | Strong | High | $2,400 |
| D — Bayside cottage Small modern build |
Strong | Strong | Low | $850 |
Illustrative composite scenarios. Specific premiums depend on individual property characteristics, current carrier conditions, and coverage selections. Always pull a binding quote on a specific property.
The key takeaway from this table: Scenario C — an oceanfront home that has been properly elevated — still pays roughly half what an unrenovated oceanfront slab home pays. The "Where" pillar is unchanged in both cases. What changed was the "How." That's the pillar most owners can move.
Fixed (Pillar One — "Where"): Distance to ocean and bay, ground elevation, flood frequency modeling. You cannot move the house. You can only mitigate against these variables through construction in Pillar Two.
Actionable (Pillar Two — "How"): First floor height (elevation projects), flood vent installation, M&E platform construction, basement fill, garage enclosure modifications. Every one of these is a measurable construction project with a calculable ROI against the resulting premium reduction.
Partly actionable (Pillar Three — "What"): RCV is determined by the home you have, but deductible selection, coverage limit selection, and whether you pair NFIP with a private excess policy are all underwriting decisions you control.
For homes that are economically worth retrofitting, the National Flood Insurance Program offers Increased Cost of Compliance (ICC) coverage as part of every NFIP policy. ICC provides up to $30,000 to help fund elevation, demolition, or relocation when a home has been substantially damaged and needs to be brought into compliance with current code. This coverage is built into your existing premium — it's not an add-on — and many owners are unaware they have access to it. The full mechanics are documented at the NFIP statutory framework page.
Buyers researching how Risk Rating 2.0 affects pricing across other NJ shore markets will find the same methodology applied to Manasquan further north and across the broader Ocean County market. The algorithm doesn't change by zip code — only the inputs do.
When The Prodigy Team underwrites an LBI property — for a buyer we represent or a listing we're taking — we score it against all three pillars before any pricing discussion. The "Where" pillar is read from FEMA and NJ DEP data. The "How" pillar is read from the property itself: foundation type, freeboard estimate, visible flood vents, M&E placement. The "What" pillar comes from a current RCV estimate keyed to comparable rebuild costs on the island.
The output is a quick read on which pillars are driving the premium and which retrofits, if any, would meaningfully change the math. For a buyer, that's information that belongs in the offer construction. For a seller, that's information that belongs in the listing copy — and frequently in the pricing strategy itself.
If you're considering an LBI purchase or sale and want a clear picture of where the property scores across all three pillars before any commitment, that's the audit we run before we talk about price.
Because the old zone-based system under-rated most coastal properties relative to their actual claim exposure. Risk Rating 2.0 prices each home individually, and for properties that were enjoying generic in-zone pricing — particularly larger or higher-RCV homes — the new individualized rate is usually higher. FEMA has implemented a statutory cap of 18% per year on most NFIP premium increases, so the full transition is happening over multiple renewal cycles rather than at once.
First-floor height. The distance between average grade and your first finished floor is the most heavily weighted single variable in the model for coastal properties. Every additional foot of freeboard above Base Flood Elevation produces a measurable premium reduction, with the largest discounts typically capped between three and four feet of freeboard depending on carrier.
Yes, but as one input among many rather than the dominant input. Your flood zone designation still informs the "Where" pillar of the rating, and Special Flood Hazard Area status still triggers mandatory insurance requirements for federally backed mortgages. The difference is that the zone no longer single-handedly determines your premium — it's combined with parcel-specific elevation, distance to water, and multiple hydrology inputs.
The NFIP uses an internal estimator calibrated against construction cost databases, parcel size, structure type, and regional rebuild economics. Owners are not required to submit an independent RCV appraisal, but the NFIP's number is sometimes lower than what a private carrier's underwriter would assign. If you suspect the NFIP's RCV is materially inaccurate, you can request a review, and many private flood carriers will independently assess RCV as part of quoting your home.
FEMA does not publish the per-property variable weightings in detail — the algorithm itself is published at a methodology level but not as a transparent scorecard for individual policies. What you can request from your insurance agent is the rating worksheet for your policy, which shows the inputs the system applied. Discrepancies between the worksheet and your actual property are the most common reason owners discover they're being over-rated.

Anthony Licciardello is the founding broker of The Prodigy Team, an independent brokerage serving Staten Island and the New Jersey shore. He works with buyers and sellers across Long Beach Island, Monmouth County, Ocean County, and Union County markets.
Prodigy Real Estate is an innovative real estate company offering high-end video production, home valuation services, purchasing, and home sales. Serving New York and New Jersey.