
Anthony Licciardello | August 11, 2026
Ortley Beach, NJ
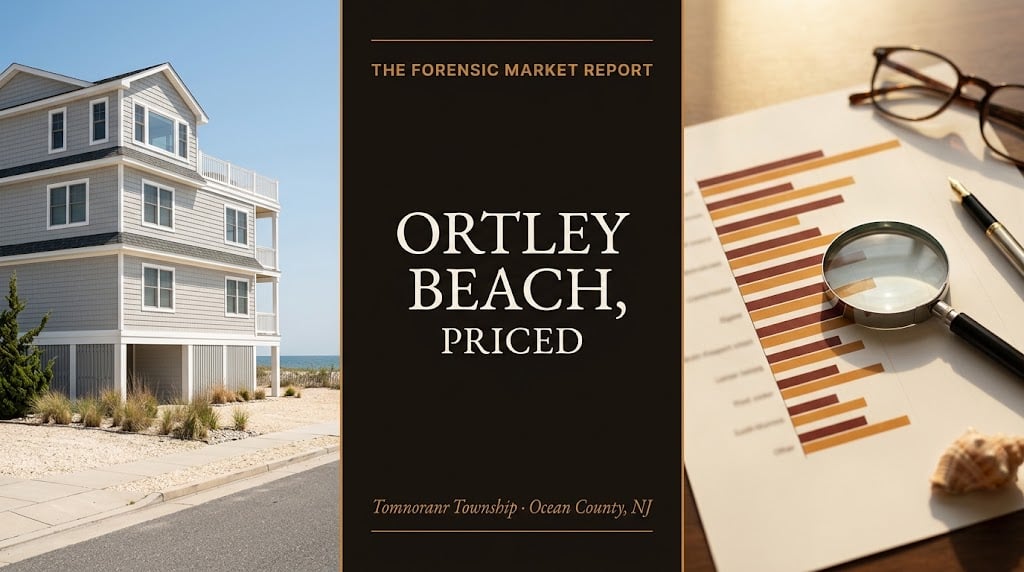
Ortley Beach may be the most mispriced-by-data community on the Jersey Shore — not because its market is mysterious, but because almost every published number describes somewhere else. Township-wide medians undershoot it by hundreds of thousands; portal estimates weighted toward oceanfront overshoot it just as far. This is the forensic report: what the Ortley-specific data actually says, which numbers we discarded and why, and how to price all three of the markets wearing this one name.
Three findings drive this report. First, the anchor: the only Ortley-specific transaction dataset we could verify — MLS closed and active listings for the neighborhood itself — puts the median around $785,000 as of May 2026 with a strikingly fast 13-day median time on market, and because it stands alone and blends closed sales with active listings it carries our DIRECTIONAL grade, honestly labeled rather than dressed up as certainty. Second, the trap: nearly every number a search engine serves for "Ortley Beach" is actually a Toms River Township blend — five township-wide sources print medians and values from roughly $399,000 to $543,000, figures diluted by thousands of mainland sales that share nothing with a barrier-island beach block — while portal value estimates sampling toward oceanfront and new construction print seven figures; Ortley is misdescribed from both directions, and we show the spread source by source. Third, the structure: this is three markets in one name — east-of-35 oceanside blocks, bayside lagoon streets, and oceanfront — layered over a rental economy running $4,000–$7,000 a week oceanside and $7,000–$14,000 oceanfront at peak, where post-Sandy rebuild vintage commands premium rates and repeat bookings. The adjudication table, the chart, and the tier-by-tier playbook follow.
This is the market spoke of our Ortley Beach hub, built on the same forensic standard as our Seaside Heights analysis one town south: every figure carries its source window, conflicting numbers are shown rather than averaged away, and what we discarded is listed with cause. Markets move — verify current figures before acting.
The anchor dataset — the only one we verified that samples Ortley Beach itself, not its township — is an MLS-based read of closed and active neighborhood listings: median approximately $785,000 as of May 2026, characterized as a balanced market, with a median 13 days on market for well-priced, well-conditioned homes. Two things about that read ring true against everything else we know: the level sits exactly where a central-island community should — below Lavallette's premium, above the mainland — and the velocity fits a market whose calling card (rebuilt, elevated, code-current stock) is precisely what today's Shore buyer is hunting.
And here is the Vortex discipline: one clean source earns an INDICATIVE grade, not a headline. We don't corroborate it with township blends (they measure a different place, as Chapter II shows) and we won't average it against portal estimates built on different samples. It's the best available number, honestly labeled — use it as a compass, then price any actual property against its tier and vintage cohort, the way Chapter IV lays out.
Because Ortley Beach is a section of Toms River Township rather than its own borough, most published "data" for it is township data — a blend dominated by thousands of mainland sales from neighborhoods that share a tax collector with Ortley and nothing else. Watch what that does to the number:
$785,000
$543,000
$484,750
~$459,400
$440,000
$439,000
Different metrics (sale medians, averages, list medians, value indexes) from different windows — shown side by side to illustrate the geographic blend, never spliced into one series. Township figures are accurate for the township; none of them describes Ortley Beach.
Discarded — ZIP-level trend tables (aggregator): failed the internal-coherence gate outright (impossible listing percentages, foreclosure-value artifacts spanning $85,000 to $1.99 million presented as a range). Not usable for any purpose.
Cautioned — township-wide figures (five sources above): failed the geographic-integrity gate for Ortley purposes — sound data about a different market. Note they also disagree with each other by $100,000+ depending on metric and window; even the "wrong" number isn't one number.
Cautioned — national-portal value estimates for the neighborhood: some print in the seven figures on samples weighted toward oceanfront and new construction — the same blend error in the opposite direction. Ortley gets mispriced from both sides; segment-level comps are the only cure.
The practical rule this chapter buys you: never negotiate an Ortley property off a number that doesn't say "Ortley" in its sample definition — and treat ZIP-level statistics with the same suspicion, since shared coastal ZIPs blend neighboring communities (the identical trap our Seaside Park analysis caught in the 08752 data one town south).
The township median undervalues your Ortley home by hundreds of thousands. Don't let a lazy number set your price.
Get a valuation built the way this report is built — Ortley-specific comps, your tier, your rebuild vintage, your side of Route 35 — backed by the New York metro buyer pool we bring to every listing.
Price structure runs east to west. East of Route 35: the volume market — oceanside blocks with walk-to-beach value and the heaviest concentration of post-Sandy rebuilds. West of 35: the bayside — lagoons, docks, sunset water, a boater's market that prices on waterfront feet, not beach steps. Oceanfront: the trophy tier, thin and fierce, where portal estimates go to be misled. Velocity confirms the desirability story: Ortley's 13-day median runs roughly three times faster than the township's 38–46-day prints — in a township whose own sale-to-list ratio holds near 98.5%, well-priced beach product simply doesn't wait.
The income layer runs on the same geography: verified peak-season weekly rates of $4,000–$7,000 for oceanside homes and $7,000–$14,000 for premium oceanfront — with the post-Sandy rebuild story itself commanding premium rates and repeat bookings, because renters shop condition and elevation just like buyers do. Demand feeds off the peninsula's whole engine: Island Beach State Park south, the Seaside Heights boardwalk next door, and Ortley's own quiet sand in between — the "sleep quiet, walk to fun" position no other central-island address matches.
Buyers: comp on two axes at once — tier (side of 35, waterfront class) and vintage (post-Sandy rebuild year, elevation, certificate) — and bring the flood file from our Flood Zones & the Rebuild — The Ortley Owner’s Guide
Ortley Beach vs. Lavallette — One Lot Line, Two Bets
Bayside vs. Oceanside — Choosing Your Side of Route 35
barrier-island framework to every candidate, because in AE and VE zones the insurance quote is part of the price. At a 13-day median, pre-approval and same-week showings aren't aggressive here; they're table stakes. Sellers: price to the Ortley cohort and say so in the marketing — your buyer has seen the township numbers, and the listing that explains the gap (neighborhood-specific comps, rebuild vintage, rental history if relevant) wins the appraisal conversation before it starts. Income buyers: underwrite on the verified weekly bands, haircut for shoulder weeks, and verify Toms River Township's current rental registration and licensing requirements before modeling a single dollar — township rules govern here, not the borough ordinances next door.
This report refreshes as Ortley-specific data deepens — more corroborating sources upgrade the grade, and we'll say so plainly when they do. Until then: start at the Ortley Beach hub for the full community picture, compare the peninsula's alternatives via the new-construction ladder and Seaside Heights hub next door, and browse the island's current inventory on our listings page.
When an Ortley listing hits, check one thing before anything else: does the asking price make sense against the tier — or against the township? Sellers (and some agents) anchor low off Toms River blends more often than you'd think, especially on estate sales and long-held bayside homes where nobody has re-run the numbers since the rebuild era began. At a 13-day median, those mispriced-off-the-blend listings are precisely the ones that vanish in a weekend — and the buyers who recognized the wrong denominator are the ones who got them. The geographic trap in Chapter II isn't just a data lesson; it's a deal-sourcing strategy.
"Ortley Beach is what happens when a great market wears the wrong name tag. Search it and you'll drown in township numbers that undershoot it by three hundred thousand dollars, or portal estimates that overshoot it just as badly — and somewhere in the noise, a rebuilt, elevated, thirteen-days-to-contract beach market goes quietly about its business. My clients don't price off noise. We pull the neighborhood's own sales, sort them by tier and rebuild vintage, and negotiate from data that actually describes the sand under the house. That's the entire edge — and in Ortley, it's a big one."
— Anthony Licciardello, Broker, The Prodigy Team
Forensic pricing in blended-data markets is the analytical core of my practice: I'm Anthony Licciardello, Broker of The Prodigy Team — dual-licensed in New York and New Jersey, a former Director of Community Affairs in the Bloomberg Administration, and a leading broker for cross-border New York–New Jersey transactions, bringing the New York market to New Jersey sellers.
Our Above the Streets cinematic drone series shows the rebuilt coastline behind these numbers — watch the barrier island episode above — with audience performance exceeding industry benchmarks for real estate media.
Anthony Licciardello · Broker, The Prodigy Team · 718-873-7345
Tier-true comps, rebuild-vintage reads, and pricing that ignores the township noise — the forensic standard, applied to your deal.
What is the median home price in Ortley Beach?
The only Ortley-specific dataset we verified — MLS closed and active neighborhood listings — puts the median around $785,000 as of May 2026, a figure we grade DIRECTIONAL because it stands on a single source and blends closed sales with active listings. Township-wide figures ($399,000–$543,000 depending on source and metric) describe Toms River as a whole, not Ortley, and some portal estimates overshoot in the opposite direction. Price any actual property against its tier and rebuild vintage, not a blended median.
Why do Ortley Beach home prices look so different across websites?
Because Ortley is a section of Toms River Township, most published figures are township blends dominated by mainland sales — undershooting the beach market by hundreds of thousands — while some portal value estimates sample toward oceanfront and new construction and overshoot instead. Neither error is malicious; both are composition problems. The cure is neighborhood-specific, tier-matched comps.
How fast do homes sell in Ortley Beach?
Fast — a 13-day median time on market for well-priced, well-conditioned homes as of the May 2026 dataset, roughly three times quicker than township-wide prints of 38–46 days, in a township whose sale-to-list ratio holds near 98.5%. For buyers, that means pre-approval and prompt showings are essential; for sellers, correct tier-based pricing gets rewarded quickly.
What do Ortley Beach summer rentals earn?
Verified peak-season weekly rates run $4,000–$7,000 for oceanside homes and $7,000–$14,000 for premium oceanfront properties, with post-Sandy rebuilt homes commanding premium rates and repeat bookings. Underwrite on peak-plus-shoulder math rather than peak alone, and verify Toms River Township's current rental registration and licensing requirements before modeling income — township rules, not borough ordinances, govern here.
The conflict. Two independent IDX-fed brokerage sites report Ortley Beach active-listing averages of approximately $548,188 across 59 listings (average 1,881 square feet against a county average of 2,158) and $542,136 across 63 listings (average 1,834 square feet). Those two agree closely with each other and sit far below our $785,000 anchor. They are a different metric — an active-listing average versus a blended closed-and-active median — so this is not a direct contradiction. But a gap of roughly $240,000 belongs on the page rather than off it, and it is part of why we grade the anchor DIRECTIONAL rather than higher.
DISCARDED — geographic contamination. A national portal's neighborhood page for this area lists popular nearby neighborhoods as Arcadian Shores, Savannah Shores, Dunes Cove, Kingston Plantation and Grande Dunes — every one of which is in Myrtle Beach, South Carolina. The same page's view-filtered subset showed four listings at a $2.1 million median on two recent sales. Excluded in full.
COVERAGE INCONSISTENCY. A third national brokerage page reports no active listings meeting its criteria for Ortley Beach while the two sources above show 59 and 63. Platform definitions of this neighborhood's boundaries plainly differ — another reason to comp Ortley property against Ortley sales rather than any platform's neighborhood roll-up.
This report follows the Prodigy Vortex Report methodology: sources are tiered by reliability, screened through six gates (monotonicity, internal coherence, single-value, vintage, geographic integrity, corroboration), and findings carry explicit confidence grades. The headline figure here is graded INDICATIVE — a single neighborhood-specific MLS-based source (May 2026) — and is presented with its window rather than as a point-in-time certainty; township-wide and ZIP-level figures were excluded from the Ortley estimate on geographic-integrity grounds and are displayed only to illustrate blending error; one aggregator's trend tables were discarded for internal-coherence failure; differing metrics (sale medians, averages, list medians, value indexes, weekly rental rates) are never spliced into a single series. Grades upgrade as corroborating Ortley-specific sources become available. Nothing here is an appraisal or a promise of value, price, rent, or market performance.
Moving to Toms River — The Complete Township Guide
Moving to Ortley Beach — The Complete Guide
Seaside Heights Prices — The Forensic Analysis Next Door
The New-Construction Ladder — Every Project, Priced
Barrier-Island Flood Rules — The Owner's Framework
Moving to Seaside Heights — The Complete Guide
Browse the Island's Current Listings
Market figures as published by their sources, with windows as noted, as of publication, for Ortley Beach (Toms River Township) and Toms River Township, Ocean County, NJ: Ortley Beach neighborhood-specific MLS-based median of approximately $785,000 with a 13-day median days on market and a balanced-market characterization (closed and active listings, May 2026, per a regional brokerage's published market page), graded INDICATIVE as a single-source figure under the Prodigy Vortex Report methodology; peak-season weekly rental rates of approximately $4,000–$7,000 for oceanside homes and $7,000–$14,000 for premium oceanfront properties per the same source; Toms River Township-wide figures shown solely to illustrate geographic blending — Redfin average sale price of approximately $543,000 (+8.5% year over year, mid-2026) and township median sale of $484,750 (+6.0%, with 46-day average days on market, a 98.5% sale-to-list ratio, and approximately three offers per home, spring 2026 reporting); Realtor.com median list of approximately $440,000 with 38 median days on market and inventory up approximately 11.5% year over year (spring 2026 reporting); Zillow typical home value figures of approximately $459,413 (+3.7%) and $398,771 (+2.8%) across differing report vintages; Movoto median list of $439,000 at approximately $293 per square foot with 33 days on market (June 2026) — all township-wide metrics describing Toms River as a whole and excluded from any Ortley Beach estimate on geographic-integrity grounds; one aggregator's ZIP-level trend tables discarded for internal-coherence failure; and unnamed national-portal neighborhood value estimates printing in the seven figures, cautioned as samples weighted toward oceanfront and new-construction stock. Differing metrics are presented side by side and never combined into a single series; figures change continuously; medians and estimates are not appraisals; and no value, rent, price, or market outcome is promised. This is general information, not legal, tax, insurance, or investment advice — verify all current figures, rental rules, and requirements with Toms River Township and your own professionals before buying, selling, or renting.
Prodigy Real Estate is an innovative real estate company offering high-end video production, home valuation services, purchasing, and home sales. Serving New York and New Jersey.