
Anthony Licciardello | August 9, 2026
Seaside Heights, NJ
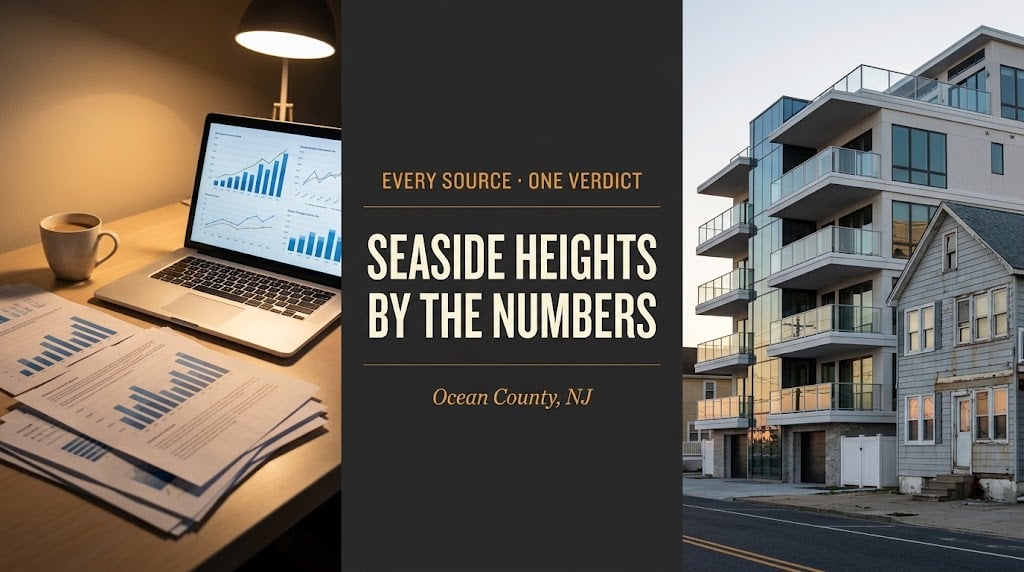
Ask five websites what a Seaside Heights home is worth and you'll get five answers spread across a quarter-million dollars — and every one of them is "right" about something. This is our forensic analysis of the borough's market: every major public source cross-referenced, the broken one discarded, the spread explained, and a defensible price band you can actually use to buy, sell, or invest.
Seaside Heights is exactly the kind of market that breaks single-number analysis: roughly ten sales a month, a stock dominated by condos from $239,000 studios to $2.5 million new construction, and premium redevelopment product entering the comps mid-stream. That's why one source shows the market down 19.7% (a single November's ten sales) while another shows it up 19% (the trailing twelve months) — both arithmetically true, neither the whole truth. Our cross-reference of every major public source — with one aggregator discarded for internal incoherence — resolves the spread: monthly medians and automated models mark the floor near $590,000, the twelve-month sale median sits at about $775,000, and list medians corroborate from $699,000 (condos) to $791,000 (all types). Verdict: a transaction band of roughly $590,000–$780,000, centered in the mid-$700,000s, grade CORROBORATED. The tell that this is transformation rather than churn is price per square foot — up 52.7% in a year to $587 — the unmistakable signature of new premium product, while a 94.7% sale-to-list ratio says ordinary resales still leave room to negotiate. The full adjudication, the discarded source, and the playbook for using the band follow.
This analysis quantifies the transformation documented in our revitalization report and enabled by the zoning framework. Figures carry their sources and windows throughout; all are snapshots as of publication.
Three structural facts make Seaside Heights hostile to headline numbers. First, volume: a typical month closes on the order of ten sales — small enough that two luxury condos or two dated studios swing the monthly median by six figures, which is exactly how one November printed a median of $590,355 and a "−19.7% year over year" headline while the trailing twelve months were up 19%. Second, mix: this is a condo-dominant market spanning $239,000 to $2.5 million, so what happened to sell moves the median more than what anything is worth. Third, transformation: the redevelopment wave is injecting premium new product into the comp pool mid-stream, which stretches every average upward while leaving older stock behind.
Automated models struggle here too: value indexes are built to smooth, which means they lag regime change by design — useful as a floor, misleading as a verdict. The honest method for a market like this is the one we use town-wide: cross-reference every major source, screen out the incoherent ones, and publish a band with a confidence grade. So that's what Chapter II does.
First, the full spread — every verified figure, sorted low to high:
Oxblood bars = closed-sale medians; amber bars = list medians and model values. Sources and windows as labeled; bars scaled to the highest figure.
And the adjudication — including what we threw out:
The trailing-year sale median (~$775K, +19%) smooths the small-sample whipsaw and is independently corroborated by current list medians ($791K all-type; $849K among homes that actually sold). Weight: highest.
A ten-sale month ($590K) and a smoothing model ($594K) converge near the same floor — real information about the market's lower regime, not its center. Weight: bounding only.
Condos: median list ~$699K, average recent sale ~$820K at the top of the mix, full range $239K–$2.5M, days on market ~50–74 by cohort, ~140 total listings across the borough. Sale-to-list 94.7% — negotiability lives here.
One national aggregator published a median list price of ~$359K beside its own ~$702K estimated value for the same town — an internal contradiction consistent with stale or contaminated inventory (timeshare-style and fractional listings are a known hazard in resort ZIP codes). It fails our coherence screen and carries zero weight. Transparency note: we show you what we discard, and why.
Adjudication per the Prodigy Vortex Report methodology: independent sourcing, coherence and vintage screens, geographic-integrity checks, and banded output with confidence grades in thin markets.
Verdict: a transaction band of roughly $590,000–$780,000, centered in the mid-$700,000s — grade CORROBORATED (two independent MLS-fed sources agree on the regime; the floor is defined by models and thin monthlies, the center by the trailing-year median, the ceiling by corroborating list data). The single best evidence that this is transformation, not noise, is the metric mix-shift can't fake for long: price per square foot at $587, up 52.7% year over year — new premium product commanding new premium unit pricing, exactly what the rulebook was rebuilt to produce.
The longer arc frames it: the borough's average single-family sale was $253,288 in 2020 and $396,739 in 2022 (+56.6%) — and today's all-type medians sit roughly triple that 2020 figure (different metrics — an average of houses then, a median of everything now — but the direction is unambiguous). Two moderating facts keep the analysis honest: the 94.7% sale-to-list ratio says ordinary resales still close below ask — this is not a Livingston-style over-ask market — and days on market of ~50–74 says liquidity is real but unhurried. Premiums concentrate in new and renovated product; dated units in aging associations trade at real discounts to the band. Both facts are leverage, depending on which side of the table you're on.
Figures are cross-referenced from independent publicly available sources (MLS-fed portals, listing platforms, and automated valuation models), screened for internal coherence, vintage, and geographic integrity; one aggregator was excluded for cause as described above. Seaside Heights trades on small monthly volumes with heavy condo mix and active redevelopment, so we publish bands with confidence grades rather than point estimates. Bands are directional market intelligence, not appraisals; the 2020–2022 figures are averages of single-family sales and are not spliced into the current all-type medians. Price any specific property off its own recent comparable sales.
Sellers: where you price inside a $190,000-wide band is a condition-and-comps argument, and in a transforming market the winning move is to comp against the trajectory — the newest relevant sales, not last year's — while presenting turn-key wherever possible, because that's where the per-square-foot surge concentrates. A 94.7% ratio means buyers expect a conversation; build your margin accordingly. Buyers: ignore scary or euphoric monthly headlines (ten sales made them), use the band to spot outliers in both directions, and negotiate confidently on dated stock while accepting that genuinely new product prices off its own scarce cohort. On condos, underwrite the association — reserves, assessments, insurance, rental rules — as carefully as the unit.
Investors: the thesis is in our revitalization report and the entitlement map in the zoning deep dive; the discipline is here — underwrite off closed comps and realistic seasonal income, never off model values in a market they demonstrably lag. We refresh this analysis as the data moves and run property-specific comp studies on request. Test the band yourself against live inventory on our Seaside Heights listings page — then bring us the unit you're circling. The full picture starts at the hub guide.
In a ten-sale-a-month town, date-stamp every comp. A closing from fourteen months ago predates a chunk of the per-square-foot surge; a closing from last quarter carries it. When you or your agent build a comp set here, sort by date first and weight the newest sales hardest — then check whether each comp is pre-renovation or post-renovation product, because the band's edges are really two different markets sharing one ZIP code. Sellers who comp against the new cohort and buyers who spot a listing priced off the old one are both exploiting the same insight: in a transforming market, when a comp closed matters almost as much as what it was.
"When five reputable sites disagree by a quarter-million dollars, most people pick the number they like. We do the opposite — we make the disagreement itself tell the story. In Seaside Heights the spread says: small market, condo mix, and a transformation injecting new value at the top. That's why I trust the twelve-month median over any single month, the per-square-foot surge over any headline, and a graded band over every point estimate. Price your sale or your offer off that discipline and you're negotiating from the strongest position in the room."
— Anthony Licciardello, Broker, The Prodigy Team
Forensic market analysis is how we earn trust before we earn business: I'm Anthony Licciardello, Broker of The Prodigy Team — dual-licensed in New York and New Jersey, a former Director of Community Affairs in the Bloomberg Administration, and a leading broker for cross-border New York–New Jersey transactions, bringing the New York market to New Jersey sellers and the metro buyer pool that powers the Shore.
Our Above the Streets cinematic drone series shows the transformation the numbers measure — watch the Seaside Heights episode above — with audience performance exceeding industry benchmarks for real estate media.
Anthony Licciardello · Broker, The Prodigy Team · 718-873-7345
We build date-weighted, renovation-aware comp studies for Seaside Heights sellers, buyers, and investors — the band, applied to your address.
What is the median home price in Seaside Heights, NJ?
It depends on the window — which is why we publish a band. The trailing-12-month sale median is about $775,000 (up 19%); single-month medians have printed near $590,000 on as few as ten sales; list medians run $699,000 (condos) to $791,000 (all types). Our cross-referenced verdict: a transaction band of roughly $590,000–$780,000, centered in the mid-$700,000s, grade CORROBORATED.
Why do websites disagree so much about Seaside Heights prices?
Three reasons: tiny monthly volume (about ten sales) lets a couple of transactions swing medians by six figures; a condo-dominant mix from $239,000 to $2.5 million means the median tracks what happened to sell; and redevelopment is injecting premium new product that models built to smooth are slow to capture. One aggregator we reviewed even contradicted itself internally and was excluded from our analysis entirely.
Are Seaside Heights home prices going up?
The trailing-year sale median is up 19%, and price per square foot is up 52.7% to $587 — the clearest signature of premium new product entering the market. The longer arc: average single-family sales went from $253,288 (2020) to $396,739 (2022), and today's all-type medians sit roughly triple the 2020 figure. Past performance doesn't guarantee anything, and monthly readings will keep whipsawing — judge the market on 12-month windows and per-square-foot trends.
Is there room to negotiate in Seaside Heights?
Generally yes: the sale-to-list ratio runs about 94.7% and days on market about 50–74, so ordinary resales close below ask after a real conversation — this is not an over-ask market. The exception is genuinely new or fully renovated product, which prices off its own scarce cohort. Dated units in aging associations offer the most negotiating room, provided you underwrite the HOA carefully.
Moving to Seaside Heights — The Complete Guide
The Seaside Heights Revitalization — Every Project, Mapped
The Zoning Changes Rebuilding Seaside Heights
Moving to Point Pleasant Borough — Up the Coast
Seaside Heights Homes for Sale — Browse Current Listings
Market figures cross-referenced as labeled, 2025–2026, for the Borough of Seaside Heights, Ocean County, NJ (ZIP 08751), as of publication, per the Prodigy Vortex Report methodology (independent sourcing; internal-coherence, vintage, and geographic-integrity screens; banded output with confidence grades in thin markets): Homes.com (MLS-fed; trailing-12-month median sale approximately $775,000, +19% year over year; condo segment median ~$780,000 and average recent sale ~$819,500; condo range approximately $239,000–$2.5 million; approximately 40 condos active; as of May 2026); Movoto (median list approximately $791,000; ~135 listings; May 2026); Redfin/NJMLS (November 2025 monthly median sale $590,355 on 10 sales, −19.7% year over year; price per square foot $587, +52.7% year over year; sale-to-list ratio 94.7%; days on market approximately 50–74 by cohort; recently sold cohort median list approximately $849,000; condo median list approximately $699,000 on ~42 active; approximately 144 total listings; mid-2026); Zillow Home Value Index (approximately $594,502, +6.8% year over year; mid-2026); one national aggregator excluded for internal inconsistency (a published median list price of approximately $359,000 alongside its own estimated median value of approximately $702,000 for the same municipality, consistent with stale or fractional-interest inventory contamination). The 2020 and 2022 figures (average single-family sale prices of $253,288 and $396,739, +56.6%) are per Asbury Park Press reporting and are a different metric from current all-type medians; they are presented as separate data points, not a spliced series. Small monthly volumes, heavy condo mix, and active redevelopment make point estimates unreliable; the published band of approximately $590,000–$780,000 (grade: CORROBORATED) is directional market intelligence, not an appraisal, a valuation of any specific property, or a promise of performance. This is general information, not investment advice. Price any specific property off its own recent comparable sales and verify all figures independently before relying.
Prodigy Real Estate is an innovative real estate company offering high-end video production, home valuation services, purchasing, and home sales. Serving New York and New Jersey.