
Anthony Licciardello | April 28, 2026
Long Beach Island
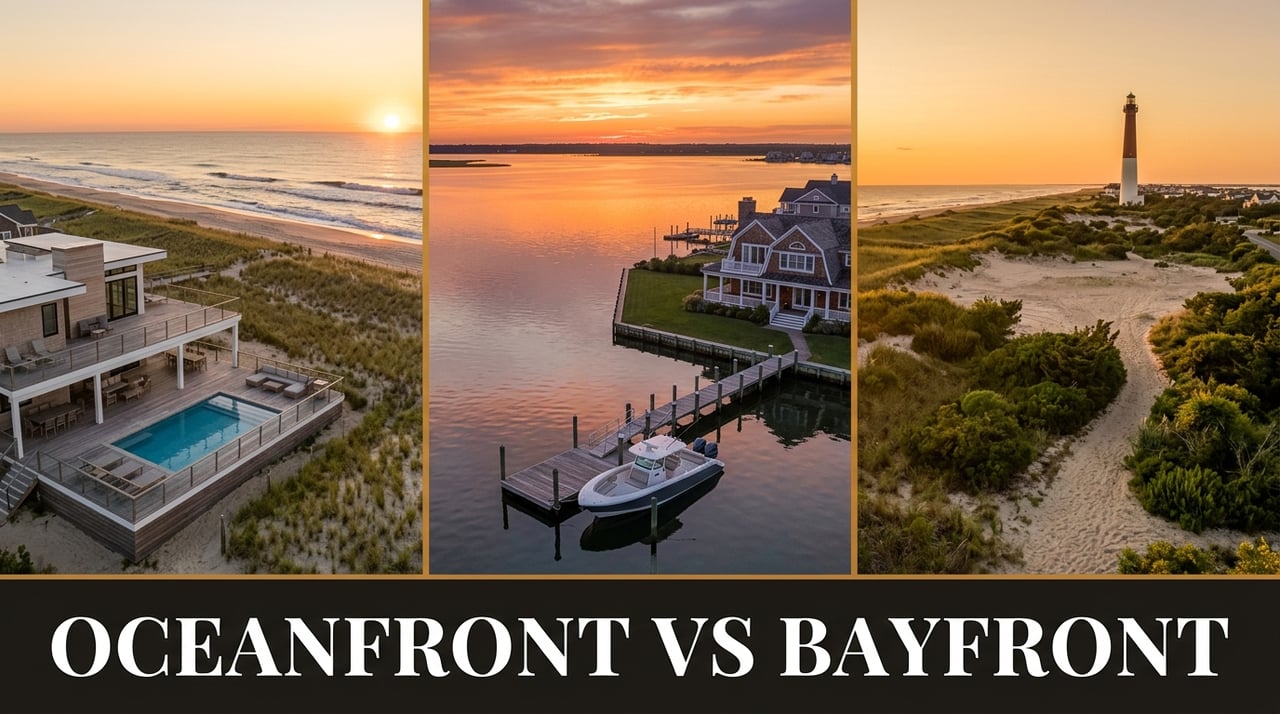

Long Beach Island has an oceanfront story everyone already knows. Eighteen miles of barrier sand, fewer than 1,000 true beachfront parcels, a top sale of $8.58 million in Loveladies in 2025, and a per-square-foot baseline north of $1,500. That story is real, and it is not changing.
The bayfront story is the one most LBI coverage gets wrong. On the surface, the 2025 numbers look soft — average bayfront sales came in at $2,618,353, a hair below where the segment closed in 2024. Look one layer deeper and the picture inverts. Industry tracking suggests that average linear footage on transacted bayfront parcels shrank meaningfully year-over-year, which means the headline average is hiding genuine appreciation. On a per-foot basis, the bayfront is appreciating faster than the ocean is.
This is the cleanest read on how Long Beach Island's buyer pool is actually evolving in 2026 — and why the oceanfront-vs-bayfront question is no longer "which is the trophy?" but "which one is your money working harder in?"
The island-wide market closed 2025 with 290 single-family transactions at an average sale price of $2,476,310 — up 6.5% over 2024, the slowest year of growth in the last five. The slow growth is the wrong headline. The real story is in the bifurcation between the two waterfront segments.
Oceanfront sales averaged $5,730,116 in 2025, with a price per square foot of $1,520.74 — roughly 41% above the island-wide average. Only 31 oceanfront homes sold across the entire year, against 52 active listings. The segment closed at 96% of asking on average, with one sale clearing 14% above list. The standout was an 8-bedroom Loveladies estate at $8.58 million — close to $2,000 per square foot.
Bayfront sales averaged $2,618,353 over 17 closings, with average days on market of 74 and a list-to-sale ratio of 95.82%. On every traditional metric, oceanfront is the more aggressive market. The trick is that traditional metrics aren't capturing what's actually happening on the bay.
| METRIC | OCEANFRONT 2025 | BAYFRONT 2025 |
|---|---|---|
| Average Sale Price | $5,730,116 | $2,618,353 |
| Total Closings | 31 | 17 |
| Avg Price Per Sq Ft | $1,520.74 | ~$900–$1,100 |
| List-to-Sale Ratio | 96% | 95.82% |
| Top Sale | $8.58M (Loveladies) | Below oceanfront ceiling |
| Standard Lot | 50 x 100 (100 x 100 in Loveladies/N. Beach) | Variable; frontage shrinking |
Oceanfront on Long Beach Island is the trophy asset, and it acts like one. The 2025 average of $1,520.74 per square foot held steady against 2024, even as inventory tightened to just 52 listings. More than half of the 31 closed homes were built after 2019, with average footprints near 3,900 square feet and five to eight bedrooms. Modern oceanfront in 2026 is FEMA-elevated, reverse-living, and priced for a buyer who isn't financing.
The Loveladies and North Beach end of the island operates by different rules than the rest of LBI. Standard lots up there run 100 by 100 feet — double the 50 by 100 footprint that defines the southern municipalities — which is the structural reason those communities consistently rank as the most expensive on the barrier. Even teardown oceanfront trades around $980 per square foot, because what you're paying for isn't the structure. You're paying for the dirt.
What oceanfront is not doing is surging. The ceiling is high but stable. Buyers willing to write $5 million-plus checks for an Atlantic-facing parcel don't need a bargain — they need supply, and supply is gone. The 31 sales recorded in 2025 were down sharply from the 55 closings the segment averaged from 2015 through mid-2020.
Here's the part most LBI market reports miss. The 2025 bayfront average of $2,618,353 looks soft against prior years. It isn't.
The methodology that uncovers what's actually happening was pioneered on Long Beach Island in 2004 — measuring waterfront values not by total sale price, but by price per linear foot of bulkhead. It's the only metric that controls for parcel size, and parcel size on LBI bayfront is highly variable. A 100-foot-frontage estate and a 50-foot lagoonfront cottage are not the same product. Lumping them into one "average sale price" tells you nothing.
Industry tracking suggests that average frontage on transacted bayfront parcels in 2025 was meaningfully smaller than what changed hands in 2024 — fewer estate-sized parcels traded, more mid-size lots cleared. When you normalize for that, per-linear-foot values are appreciating at a rate well ahead of the islandwide single-family market. The headline says flat. The underlying dirt says up.
The structural argument for bayfront is regulatory, not cyclical. New Jersey's Coastal Area Facility Review Act and the Department of Environmental Protection regulate every bulkhead, dock, and lift on Barnegat Bay. State policy on tidelands grants — the legal mechanism that gives a parcel riparian rights — has tightened substantially. The state no longer issues riparian grants for currently flowed tidelands; only previously filled parcels qualify. Translation: an existing bayfront with a documented dock and bulkhead is a finite asset. You cannot manufacture a new one.
That's the same scarcity argument that drives oceanfront pricing — except oceanfront has been priced for that scarcity for two decades. Bayfront is still catching up.
Bayfront is not "discount oceanfront." That framing is the single biggest misread of the LBI market right now. The buyers are different people making different bets.
The oceanfront buyer wants surf. They want sunrise from the primary suite, the sound of waves through an open slider, multi-generational beach days, and a level of prestige that bayfront doesn't deliver. Oceanfront purchases skew toward households with school-age children and toward legacy-asset thinking — the kind of property that gets handed down rather than sold.
The bayfront buyer wants water access — boats, kayaks, sunset orientation, paddleboards, a dock for fishing rods and a lift for a center console. Bayfront skews toward empty nesters, active boaters, and buyers whose primary residence is inland. They want the bay as the backyard, not as a view from a deck looking the wrong direction. The 74-day average days-on-market for bayfront isn't a sign of weak demand. It reflects more complex due diligence — bulkhead inspections, dock condition, water depth, riparian rights verification — that adds friction to closings without changing the underlying buyer urgency.
The Hamptons made this transition twenty years ago. The pure beachfront market detached from the bay-and-pond market, and bay-side waterfront in places like Sag Harbor and Shelter Island grew into its own asset class with its own pricing logic. LBI is somewhere in the middle of that same shift in 2026.
$5M oceanfront in 2025: A teardown on a standard 50x100 lot, or an aging 3-bedroom needing renovation. The structure rarely justifies the price — you're capitalizing the dirt.
$5M bayfront in 2025: A new-construction 5- or 6-bedroom estate with a private dock, lift, and meaningful linear footage. Per-dollar lifestyle delivery favors the bay.
The 30-year fixed rate sat at 6.23% as of late April 2026, per the Freddie Mac Primary Mortgage Market Survey — the lowest level in three spring homebuying seasons. National housing markets are calibrating to that number. Long Beach Island's upper bracket is not.
The buyer pool above $2 million on LBI is dominated by cash. Industry data on Q1 2026 closings suggests the upper tier is structurally insulated from the rate environment — buyers writing $3M, $5M, and $8M checks for waterfront aren't financing them at conventional terms. They're deploying liquidity from sold equities, business exits, or other real estate. The Federal Reserve's policy posture matters to the sub-$2M tier on the island, where financed purchases still lead. Above that line, rate moves are roughly irrelevant.
This is why LBI's overall pricing has decoupled from national housing indices. The market's price-setters are not the marginal buyer. They are the cash buyer who would have closed at 7%, would have closed at 8%, and is closing at 6.23%.
Long Beach Island has no raw land left. Every new home on the island in 2026 starts with the acquisition and demolition of an older structure. Demolition runs $10,000 to $15,000. Quality new construction — FEMA-elevated, deep pilings, modern coastal finishes — runs $350 to $400 per square foot for the build itself, including permits and plans.
That arithmetic produces a hard floor under the entire market. Buy a $1.5M oceanside teardown on a 50x100 lot, pay $15K for demo, build a 3,000-square-foot modern home at $400 per foot — your basis is $2.71M before furniture. The Q1 2026 new construction segment on LBI delivered seven closings at an average $1,158 per square foot, validating the build math. You cannot deliver a new home to this island for less than what these numbers say.
The same floor applies to bayfront. A bayfront teardown on a parcel with documented riparian rights and an existing bulkhead carries the same construction floor as oceanfront — but with the added scarcity premium of riparian access that the state will not issue new permits for. It's the cleanest example on the island of why the bayfront's per-foot appreciation is structural, not speculative.
It depends on what you're buying for. The honest framework looks like this:
Buy oceanfront if: Prestige and resale ceiling matter more than per-dollar utility. Your household is beach-first — surfing, sunbathing, multi-generational beach days. You have $5M-plus to deploy without leverage. You're willing to accept the smallest, oldest physical structure your budget allows in exchange for the most coveted dirt on the Jersey Shore.
Buy bayfront if: Boating, fishing, paddling, and sunset orientation define how you actually use a shore home. You want more square footage, more lot, and meaningful linear water frontage at half the basis. You're comfortable with the additional due diligence — bulkhead age, dock specs, riparian documentation, water depth — that bayfront purchases require. You believe the per-foot appreciation curve has more room to run than the already-elevated oceanfront baseline.
Neither is wrong. They are different products for different lives. What's changed in 2026 is that the bayfront-as-discount thesis is dead. Bayfront is its own asset class on Long Beach Island now, and it's pricing accordingly.
Long Beach Island's oceanfront remains the trophy asset on the Jersey Shore. None of the 2025 data suggests otherwise. What the data does suggest is that the bayfront-vs-oceanfront spread — the historical assumption that bayfront trades at a meaningful discount because it's "the lesser water" — is closing on a per-foot basis even as the headline averages move sideways.
For buyers willing to trade surf for sunset, bayfront in 2026 delivers more home, more land, and an appreciation curve that's accelerating faster than the headline averages reveal. For sellers sitting on bulkheaded parcels with documented riparian rights, the dirt under your house is worth more in linear-foot terms than it was a year ago — even if the comparable sale next door makes it look otherwise. Pricing strategy has to account for that. Anything less leaves money on the table.
The full island-wide picture sits in the broader Long Beach Island NJ Real Estate 2026 Market Report. For sellers planning a 2026 listing, the closing-cost mechanics covered in New Jersey Closing Costs in 2026 apply to LBI waterfront sales the same way they apply anywhere in the state. And the three regulatory changes rewriting the Jersey Shore real estate playbook directly affect both oceanfront and bayfront transactions in 2026.
Data sources: islandwide single-family sales statistics from Sand Dollar Real Estate (LBIRealEstateNews.com) 2019–2025 dataset. Oceanfront and bayfront segment data from The Van Dyk Group 2025 sales reviews. Mortgage rate data from Freddie Mac Primary Mortgage Market Survey, week ending April 23, 2026. Construction cost benchmarks from active LBI new-construction sales, Q1 2026 (7 closings, $1,158/sqft average). Riparian and CAFRA regulatory framework from NJDEP Coastal Zone Management Rules (N.J.A.C. 7:7) and Bureau of Tidelands Management. Per-linear-foot appreciation referenced as industry tracking — methodology pioneered by waterfront brokers tracking LBI MLS bayfront and oceanfront sales by linear footage since the 1990s.
Prodigy Real Estate is an innovative real estate company offering high-end video production, home valuation services, purchasing, and home sales. Serving New York and New Jersey.