
Anthony Licciardello | November 16, 2026
Garwood, NJ
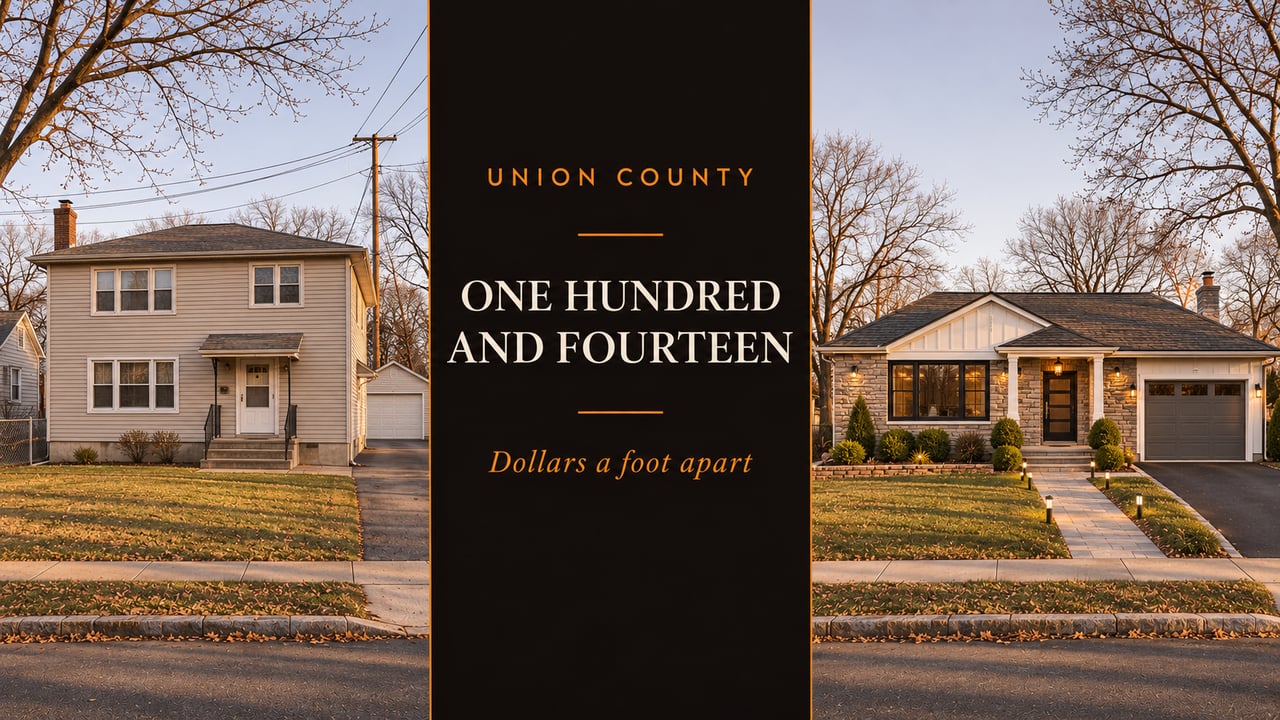
Garwood vs Kenilworth: The Borough With the Higher Median Is the Cheaper One Per Square Foot
By Anthony Licciardello, Broker · The Prodigy Team · Published November 15, 2026 · Garwood and Kenilworth, New Jersey
Four miles apart, and the borough with the larger median is the cheaper place to buy a square foot of house by nearly a quarter. It is the cleanest inversion in the county's data, and it is not the only one.
Garwood and Kenilworth are two of the smallest boroughs in Union County, four miles apart, and in November 2026 they produce the cleanest inversion in the county’s data. Garwood’s median sale price is $779,458 against Kenilworth’s $624,566 — 24.8 percent higher. Garwood’s price per square foot is $391 against Kenilworth’s $505 — 22.6 percent lower. The borough that looks more expensive is the cheaper place to buy a square foot of house, by nearly a quarter. Kenilworth also went from 75 days on market to 22, the largest speed gain in Union County.
Side by Side The Inversion 53 Days It Happens Countywide The Small-Sample Problem What to Do FAQ
Three months ending October 2026. Garwood first, Kenilworth second, in every row.
$779,458
Garwood · up 19.0%
$624,566
Kenilworth · up 11.7%
$391
Garwood · down 8.9%
$505
Kenilworth · up 5.9%
37
Garwood · from 33
22
Kenilworth · from 75
16
Garwood · from 12
14
Kenilworth · from 14
Every row except the first favours Kenilworth, and the first row is the only onemost coverage prints.
These two figures can only both be true in one circumstance: Garwood sold much larger homes than Kenilworth did.
🎯
$505 against $391. Kenilworth is the fourth most expensive square foot in Union County, behind only Summit, Westfield and New Providence. Its median sale price ranks ninth of thirteen.
A median is the middle closing at whatever size it happened to be. Divide by floor area first, as the per-foot measure does, and the ordering flips. Garwood’s higher median is buying more house, not better house — at least not on the one measure that holds size constant.
The year’s movement deepens it. Garwood’s median rose 19.0 percent while its per-foot price fell 8.9 percent: a 27.9-point divergence, the widest in Union County and the top entry on the county divergence index. Kenilworth’s median rose 11.7 percent against a 5.9 percent per-foot rise — a 5.8-point gap, one of the tightest in the county and a sign that its headline is close to honest.
The largest change in market speed anywhere in Union County this year, and it belongs to a borough that closed fourteen homes.
A year ago the median Kenilworth home took 75 days to sell. This year it takes 22. That is a 53-day improvement, against a county median of 26 days. Kenilworth has gone from one of the slowest markets in Union County to one of the five fastest, level with Westfield and behind only Summit, New Providence and Roselle Park.
Garwood moved the other way, from 33 days to 37, and it did so while its per-foot price fell 8.9 percent. Slower and cheaper per foot, with a median up 19.0 percent, is the least internally consistent set of figures any Union County town produced this quarter.
Days on market is the one published measure that is indifferent to what sold. A borough can sell nothing but large colonials and its median will jump, but the clock runs the same on every listing. Kenilworth’s 53-day gain and its 5.9 percent per-foot rise point the same way; its median agrees with both. That is three measures in alignment, which is rare and worth more than any single headline.
In a Fourteen-Sale Month, the Town Percentage Is Guesswork
Garwood’s median says up 19.0 percent; its price per square foot says down 8.9. On sixteen closings, two unusual houses write the headline. Your house is not in that headline unless somebody puts it there deliberately.
Anthony Licciardello has spent twenty-two years and more than five thousand closings learning which number to price against. The per-foot comparables, the mix-adjusted read and the transfer-fee arithmetic are run before your house goes live — not after the first price cut. Broker, dual-licensed in New Jersey and New York, across seven New Jersey counties and Staten Island.
Or request a pricing read at prodigyre.com — no obligation, and you keep the analysis either way.
Rank all thirteen Union County towns by median sale price, then rank them again by price per square foot, and seven of the thirteen move by two places or more.
Mountainside
4 → 10
Median $984,315 (rank 4 of 13) · $386 per square foot (rank 10 of 13) · 6 places dearer-ranked than it prices
Garwood
6 → 9
Median $779,458 (rank 6 of 13) · $391 per square foot (rank 9 of 13) · 3 places dearer-ranked than it prices
Elizabeth
7 → 12
Median $654,545 (rank 7 of 13) · $332 per square foot (rank 12 of 13) · 5 places dearer-ranked than it prices
Kenilworth
8 → 4
Median $624,566 (rank 8 of 13) · $505 per square foot (rank 4 of 13) · +4 places cheaper-ranked than it prices
Roselle Park
9 → 7
Median $582,095 (rank 9 of 13) · $406 per square foot (rank 7 of 13) · +2 places cheaper-ranked than it prices
Linden
10 → 5
Median $549,618 (rank 10 of 13) · $462 per square foot (rank 5 of 13) · +5 places cheaper-ranked than it prices
Rahway
11 → 8
Median $534,628 (rank 11 of 13) · $394 per square foot (rank 8 of 13) · +3 places cheaper-ranked than it prices
Mountainside is the sharpest. It has the fourth highest median in the county at $984,315 and the fourth lowest price per square foot at $386 — tenth of thirteen. Linden runs the other way: tenth by median at $549,618, fifth by price per square foot at $462. Elizabeth is seventh by median and twelfth per foot — a five-place drop, and the reason its $164,886 median lead over Plainfield shrinks to $12 a foot once size is held constant, which is worked through in the Plainfield and Elizabeth comparison. Roselle Park moves up two places, ninth by median and seventh per foot, and overtook neighbouring Roselle per foot this year. In each case the median is reporting floor area and being read as price.
Six towns do not move by more than one place — Summit, Westfield, New Providence, Plainfield, Fanwood and Roselle. In those, the median and the per-foot figure broadly agree about where the town sits, and the headline is a fair rough guide — Summit and Westfield hold first and second on both measures, as their head-to-head sets out. In the other seven it is not.
Garwood closed 16 homes in October. Kenilworth closed 14. Neither figure can carry the weight a percentage implies.
This is the reason the comparison above is built on the gap between two measures rather than on either measure alone. A sampling error that inflates a borough’s median tends to inflate its per-foot figure too, so the distance between them is steadier than either number by itself. It is not immune, but it is harder to fool.
The practical reading is different in each borough, and in neither is it the headline.
Selling in Garwood. Do not take the 19.0 percent to your pricing conversation. The size-adjusted measure for your borough fell 8.9 percent and the market is four days slower than last year. Ask for closed per-foot comparables on homes within roughly 15 percent of your square footage. If your house is on the smaller side of Garwood’s stock, the headline is particularly unlikely to describe it.
Selling in Kenilworth. Your borough’s three measures agree, which is unusual and useful. Per-foot values rose 5.9 percent, the median rose 11.7 percent, and the market is 53 days faster. At $505 a foot Kenilworth prices above Linden, Fanwood, Roselle Park, Rahway and Garwood, which is not where its median ranks it. If you have been valued off borough medians, get a second read.
Buying in either. Garwood at $391 a foot is the cheaper square foot by $114 and the slower market by fifteen days, which is the combination that gives a buyer room. Kenilworth at 22 days is a market where hesitation costs, and its per-foot price is supported by both of its other measures.
We price small boroughs off per-foot comparables at your square footage, because in a fourteen-sale month the town median is the least reliable number on the page. Twenty-two years and more than five thousand closings across seven New Jersey counties and Staten Island. The desk is on 718-873-7345.
“Four miles apart, and the borough with the bigger number on the median is the cheaper one per square foot by a hundred and fourteen dollars. I have had Garwood owners quote me nineteen percent off a news story about a market that sold sixteen houses, and the size-adjusted figure for that same market and that same quarter is down nearly nine. In a town this small the median is not a market indicator, it is a description of which sixteen houses happened to close. The per-foot number and the clock are what I work from.”
Anthony Licciardello · Broker, The Prodigy Team
Which is more expensive, Garwood or Kenilworth?
It depends which measure you use, and they disagree. Garwood’s median sale price is $779,458 against Kenilworth’s $624,566, so Garwood looks 24.8 percent more expensive. Per square foot Kenilworth is $505 against Garwood’s $391, so Kenilworth is 29.2 percent dearer for the same amount of house. The per-foot figure is the one that holds size constant, and by it Kenilworth ranks fourth in Union County while Garwood ranks ninth.
Why would a town with a higher median have a lower price per square foot?
Because it sold larger homes. The median is the middle transaction at whatever size it happened to be, so a quarter weighted toward bigger properties lifts it without any house becoming more valuable. Dividing each sale by its floor area before ranking removes that effect, and in Garwood and Kenilworth it reverses the ordering entirely.
How much faster is Kenilworth selling?
The median Kenilworth home sold in 22 days against 75 a year earlier, a 53-day gain and the largest in Union County. Garwood moved the other way, from 33 days to 37. The county median is 26 days.
Can I trust percentages from towns this small?
Treat them as directional only. Garwood closed 16 homes in October and Kenilworth 14, and the per-foot median is computed on a smaller subset still — only sales with a recorded floor area. Two unusual houses move a double-digit percentage on bases that size. The $114 per-foot gap and the 53-day speed change are large enough to be meaningful; the 19.0 percent and 11.7 percent median moves are not figures to price a house against.
Which other Union County towns show this median-versus-per-foot inversion?
Seven of the thirteen towns with published figures shift by two or more places when ranked by price per square foot instead of by median. Mountainside moves furthest, from fourth by median to tenth per foot. Linden moves from tenth by median to fifth per foot, Elizabeth from seventh to twelfth, Kenilworth from eighth to fourth and Rahway from eleventh to eighth. Summit, Westfield, New Providence, Plainfield, Fanwood and Roselle barely move.
Where do these figures come from?
Redfin’s Garwood and Kenilworth housing-market pages, read on 15 November 2026 for the three months ending October 2026, together with the eleven other Union County municipal pages used for the ranking. The rank comparison and the divergence figures are this desk’s own arithmetic. Redfin figures are not reconciled against GSMLS, Zillow or Realtor.com, which run different datasets.
All 13 towns ranked by divergence · Roselle Park vs Roselle · Plainfield vs Elizabeth · Summit vs Westfield · Union County by home type · Cranford downtown progress · Mortgage rate payment math
Sources and method. Median sale price and its year-over-year change, median price per square foot and its year-over-year change, median days on market against the prior year, and October closings against October 2025, read from the Redfin Garwood and Kenilworth housing-market pages on 15 November 2026 for the three months ending October 2026. The thirteen-town rank comparison uses the same fields from the eleven other Union County municipal housing-market pages read the same day. The rank positions, the rank shifts, the divergence figures and the percentage gaps between the two boroughs are this desk’s own arithmetic rather than figures Redfin prints. Coverage and exclusions: thirteen of Union County’s 21 municipalities publish a full Redfin housing-market page. Scotch Plains, Berkeley Heights, Clark, Hillside, Springfield and Union Township do not and are excluded rather than estimated from a different series; Cranford’s city record returned a geography with a single recorded sale and was excluded as unusable. Redfin reports 308 October closings for the county against 584 across the thirteen town pages, so town and county counts rest on different bases and are not divided into one another. Price per square foot is a median across sales carrying a recorded floor area and does not adjust for land, condition or finish.
In a market that closes fourteen homes a month, the town percentage is the weakest number available. Send us the address and the square footage and we will build the per-foot comparable set that actually applies to your house.
Prodigy Real Estate is an innovative real estate company offering high-end video production, home valuation services, purchasing, and home sales. Serving New York and New Jersey.