
Anthony Licciardello | August 30, 2026
Kenilworth, NJ
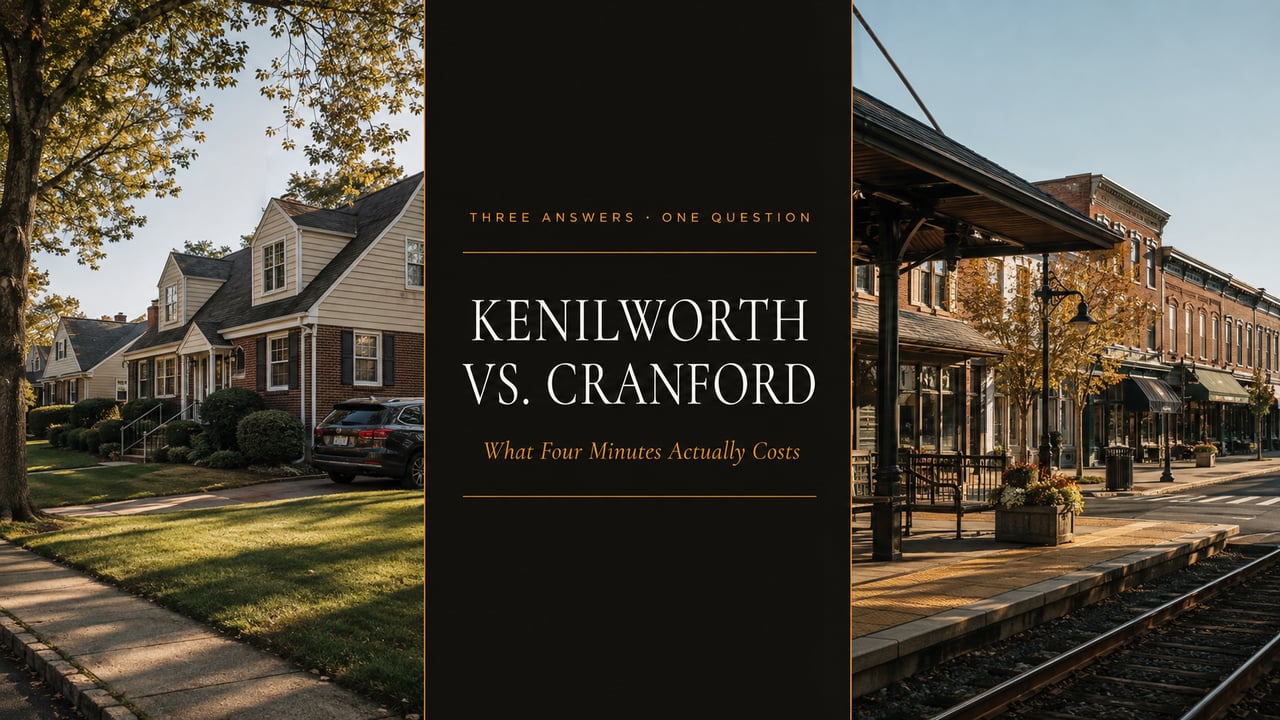
Ask what the price gap is between Kenilworth and Cranford and you will get three defensible answers spanning a hundred and ninety-five thousand dollars — $150,000, $193,000, or $345,000 — depending entirely on which sources you compare. All three are honestly calculated. Only one of them compares the two towns on the same basis, and it is the one nobody quotes.
Three sources give three gaps. A June 2026 county-wide report that tiers every Union County town on one methodology puts Kenilworth at $520K and Cranford at $865K — a $345,000 gap. Mixing platforms gives $602K against $795K, or $193,000. Commonly published figures give roughly $150,000. The largest single distortion is product mix: Cranford carries a real condominium and townhouse segment — a $372,000 townhouse median and a $349,900 two-bedroom median against a $805,500 single-family median — while Kenilworth is roughly 75% owner-occupied single-family. Comparing "medians" across these two towns compares different products. The number that decides it is what you pay for four minutes.
These two boroughs share a border and roughly three miles. They are compared constantly and almost never on comparable terms. Every figure below carries its source, its date and what it measures — because in a comparison this close, the methodology is the answer.
A June 2026 county-wide brokerage report tiers every Union County municipality on a single basis: Kenilworth $520,000 in the entry tier alongside Linden ($510K) and Hillside ($570K); Cranford $865,000 in the upper tier alongside Scotch Plains and Berkeley Heights. Same analyst, same month, same method — which is the only way a comparison of this kind is genuinely valid. County-wide that month: 341 single-family closings, up 7.9% year over year, at a $750,000 median.
Kenilworth at $602,000 (March 2026 median, with a $631,594 average sale at 38 days) against Cranford at $795,000 (April 2026 median sold, 13 days, on 65 sales up from 44 a year earlier). Both are solid figures. They are from different platforms and different months, which is exactly how a comparison drifts.
Roughly $565,000 against $715,000 — the numbers most often repeated for these two towns, including in materials we have published ourselves. Against 2026 transactional data, both now appear to lag their markets.
Nobody is lying in any of those three rows. They differ because a median can measure a single month or twelve, closed sales or active listings, all housing or single-family only — and because both towns are small enough that a handful of transactions moves a monthly figure. The lesson is not that one source is wrong. It is that a gap quoted without its basis is decoration.
A national listing platform returned "best and safest neighborhoods" lists for both towns consisting of Manhattan and Jersey City districts — Tribeca, the West Village, Gramercy Park, Paulus Hook, Journal Square, Weequahic. Neither Cranford nor Kenilworth has neighbourhoods of that kind. The headline price may be usable; nothing else on those pages is.
A foreclosure-data aggregator reported that "the percentage of properties for sale in the zip code is 132.00%," alongside Cranford median values ranging from $299,623 to $1,651,052 in the same sentence. An impossible percentage is a reliable signal to stop reading.
Our recommendation for anyone actually deciding between these towns: use the $345,000 same-source figure to understand the tier difference, and then throw the town medians away entirely and comp the specific houses you are considering. The next two chapters explain why that second step is not optional here.
2.06 square miles · 8,289 residents (2020), eight miles southwest of Newark
Its own borough school district — Warren G. Harding Elementary, David Brearley Middle/High
Garden State Parkway Exit 138 inside the borough · Route 22 on the northern edge
No train station · NJ Transit bus 113 on the Boulevard to Port Authority
Galloping Hill Park & Golf Course — laid out 1928 by A.W. Tillinghast
Roughly 75% owner-occupied, 22% rented · Capes, split levels, Colonial Revivals
Nine houses listed in a recent snapshot, $539,900 to $1,249,000
A walkable downtown built around a Raritan Valley Line station — the thing Kenilworth does not have
The Rahway River through the centre, with the Olmsted-designed Parkway landscape
The Cranford School District, township-run
The North Cranford Historic District — 948 properties, ~80% contributing, and no Certificate of Appropriateness requirement
A real condominium and townhouse segment — the detail that breaks most comparisons
0.60 months of supply on 11 active listings · 13 to 18 days on market
The structural difference is one sentence long. Cranford is a rail town with a downtown built around a station. Kenilworth is a car town with a Parkway exit inside its borders. Union County prices walkability to a train heavily, and everything else in this comparison follows from that.
What Kenilworth has that surprises people is that the compromise is narrower than the price suggests. It runs its own school district — unusual for two square miles — with a single small high school rather than a regional arrangement. It has Parkway access most Union County towns would trade for. And Galloping Hill was laid out by A.W. Tillinghast in 1928, the architect of Winged Foot and Baltusrol's Lower Course. A county public course by one of the most significant golf architects in American history sits on the borough's edge, and it appears in almost no Kenilworth listing.
Here is the distortion that breaks nearly every published comparison of these towns. Cranford's single-family median is $805,500. Its townhouse median is $372,000. Its two-bedroom median is $349,900. Recent Cranford sales on the same source range from a $292,000 Parkway Village transaction to a $1,487,500 new-construction sale.
Kenilworth is roughly 75% owner-occupied and overwhelmingly single-family — capes, split levels and colonials. So an all-property median for Cranford is dragged down by condominium and townhouse product that Kenilworth barely has, while Kenilworth's median is essentially a single-family figure. Compare those two numbers and you are not comparing towns. You are comparing a mixed-product median against a single-product one, and the gap you calculate is partly an artefact.
Corrected for product, the picture is starker, not gentler. Cranford single-family at $805,500 against Kenilworth's largely single-family median near $602,000 is a gap of roughly $203,000 on like-for-like housing — and the same-source June figures put it wider still. Cranford is not modestly more expensive than Kenilworth. It is a tier above it, and the county reports treat it that way.
With 11 active listings reported in a recent snapshot and a twelve-month median sale of $770,000, up 3%. Separately, 65 homes sold in April 2026 against 44 a year earlier. Under one month of supply is among the tightest conditions in the county — buyers here compete, and well-priced homes clear inside two weeks.
A March 2026 median of $602,000 with an average sale of $631,594 at 38 days; a May list median of $624,000 at $390/sqft with 26 days. The trailing-twelve-month average is up about 7%. Slower, but appreciating faster from a lower base — and with value estimates still anchored near $440,500, more than $100,000 behind the closings.
Read the velocity difference as information about competition, not quality. Thirteen days means multiple offers and little room to negotiate. Thirty-eight days means you can think, inspect properly and structure an offer that protects you. For a buyer, Kenilworth's slower market is a feature. For a seller, Cranford's speed is the reason the premium holds.
And one primary source worth knowing about, because almost nobody uses it. Weekly Union County property-transfer records publish every recorded sale with address, square footage and price per foot. Cranford transfers in one August 2026 week ran $327,500 (806 sq ft), $590,000 (1,632 sq ft), $725,000 (1,712 sq ft) and $760,000 (1,328 sq ft) — a spread of $432,500 in a single week, at $362 to $572 per foot. That is what a "median" is averaging over. If you want to know what Cranford actually costs, read the transfers, not the headline.
A Cranford single-family comped against a townhouse median, or a Kenilworth house priced off a $440,500 estimate — both cost you the same thing.
Cranford's town median blends $349,900 two-bedrooms with $1,487,500 new construction. Kenilworth's value estimates run more than $100,000 behind its closings. In both towns the published number is the wrong instrument — and in a 0.60-month supply market with 11 active listings, pricing correctly the first week is worth more than any marketing that follows. Get a valuation built from matched closed sales in your own municipality. Backed by the New York metro buyer pool we bring to every listing.
The honest answer turns on one variable, and it is not price. Kenilworth is four to six minutes' drive from the Cranford and Roselle Park stations on the Raritan Valley Line. Cranford is a walk. Everything you are paying the premium for is contained in that difference — and whether it is worth it depends entirely on how many mornings a week you make the trip.
Pay the premium and stop deliberating. A four-minute drive plus parking, ten times a week, fifty weeks a year, is a real tax on your life — and it compounds in winter and on delayed evenings. Cranford's walkable downtown and station access are precisely what the higher tier buys, and they are worth it if you use them daily.
Four or six drives a week instead of ten changes the arithmetic completely. You are paying a permanent premium for an inconvenience you experience twice. This is the strongest case in the entire comparison, and it is the one that has changed most since 2020.
Parkway Exit 138 inside the borough, Route 22 on the edge. You would be paying a rail premium for a station you never enter. Take the two hundred thousand dollars.
With Cranford at 0.60 months of supply and 11 active listings, entry there means competing hard at the top of your budget. Kenilworth's nine listings ran $539,900 to $1,249,000 in a recent snapshot, at 38 days. Kenilworth is where the county is still enterable — and at roughly 7% appreciation, entering is the decision that matters.
The 948-property North Cranford Historic District, an Olmsted-designed river parkway and a genuine walkable centre are things Kenilworth does not have and cannot manufacture. If that is what you are buying, buy it — and note that the district carries no Certificate of Appropriateness requirement, so you can renovate more freely than most buyers assume.
Whichever way you lean, do three things before you decide. Pull the actual tax bill on each specific parcel rather than applying a rate to a price. Build both all-in monthlies — principal and interest, real taxes, insurance quoted on that structure. And drive from the Kenilworth house to the Cranford station platform at 7:40 on a weekday and park. That last one takes fifteen minutes and answers the question the entire price gap rests on.
And one closing note on timing. Kenilworth's twelve-month average is up about 7% while Cranford's twelve-month median is up about 3%. The gap between these two towns has been narrowing, not widening. Nobody can tell you where that goes next — but a borough appreciating at twice its neighbour's rate, from a base its own value estimates still understate by six figures, is not a market that stays quiet indefinitely. Union County context sits in our county rental report and our Cranford development guide.
When anyone quotes you a gap between these two towns, ask one question: what are the two numbers, and where did each come from? We found three defensible answers spanning a hundred and ninety-five thousand dollars, and the difference between them was never dishonesty — it was one figure from a county report, another from a listing platform, a third from a value model, casually subtracted from each other. A comparison is only as good as its worst source. If the person telling you Cranford costs "about a hundred and fifty thousand more" cannot name where both halves came from and what month they describe, they have not compared the towns. They have compared two numbers.
"I went looking for the gap between Kenilworth and Cranford and came back with three numbers — a hundred and fifty thousand, a hundred and ninety-three, and three hundred and forty-five. All defensible. The three-forty-five is the honest one because it's the same analyst pricing both towns in the same month. And here's what nobody accounts for: Cranford has townhouses at three-seventy-two and two-bedrooms at three-fifty inside its town median, and Kenilworth is basically all single-family. You're comparing different products and calling it a town comparison. What it really comes down to is four minutes. Four minutes from a Kenilworth driveway to the Cranford platform. If you're on that train five days a week, pay for Cranford. If you're hybrid or you drive, take the two hundred grand."
— Anthony Licciardello, Broker, The Prodigy Team
Reading three sources against each other and telling a client which one actually applies to their house is the work: I'm Anthony Licciardello, Broker of The Prodigy Team, dual-licensed in New York and New Jersey, a former Director of Community Affairs in the Bloomberg Administration, and a leading broker for cross-border New York–New Jersey transactions.
Anthony Licciardello · Broker, The Prodigy Team · 718-873-7345
We comp matched product in each municipality, pull both tax bills, and build the all-in monthly before you choose.
How much cheaper is Kenilworth than Cranford?
There are three defensible answers spanning $195,000. The most reliable is $345,000 — a June 2026 county-wide report tiering every Union County municipality on one methodology puts Kenilworth at $520,000 and Cranford at $865,000. Comparing best-available figures from each town separately gives $602,000 against $795,000, a $193,000 gap. Commonly quoted figures give roughly $150,000. A gap quoted without its basis is not a comparison — always ask what each number measures and what month it describes.
Why do Cranford's price figures vary so much?
Because Cranford has a genuine condominium and townhouse segment inside its town median. Its single-family median is $805,500, its townhouse median $372,000 and its two-bedroom median $349,900, with recent sales ranging from a $292,000 transaction to a $1,487,500 new build. Kenilworth is roughly 75% owner-occupied and overwhelmingly single-family, so its median is effectively a single-family figure. Comparing the two town medians compares different products — comp single-family against single-family instead.
Is Kenilworth worth it without a train station?
It depends entirely on how many days a week you board a train. Kenilworth is four to six minutes' drive from the Cranford and Roselle Park stations on the Raritan Valley Line, and has Garden State Parkway Exit 138 inside the borough plus NJ Transit bus 113 to Port Authority. For a five-day rail commuter, Cranford's walkability is worth its premium. For a hybrid worker or a driving commuter, the premium buys an inconvenience you rarely experience — and the difference is roughly $200,000. Verify schedules with NJ Transit.
Which town is harder to buy in right now?
Cranford, by a wide margin. It has been reported at 0.60 months of supply on 11 active listings, with homes selling in 13 to 18 days. Kenilworth ran 26 to 38 days with nine houses listed from $539,900 to $1,249,000 in a recent snapshot. Cranford's speed means competing at the top of your budget; Kenilworth's pace gives you room to inspect properly and structure an offer. Note also that Kenilworth's twelve-month average is up about 7% against Cranford's roughly 3% — the gap has been narrowing.
Moving to Kenilworth — The Value Play With No Train Station
The North Cranford Historic District — 948 Properties
Cranford Downtown Development — 2026 Progress Report
Union County Rental Market — Where the Concessions Are
Kenilworth Homes for Sale · Cranford Homes for Sale
Figures as of publication, from the sources noted, measuring different quantities over different periods. Same-source comparison: a June 2026 Union County market report from a regional brokerage tiers municipalities as entry-level $400K–$600K including Linden ($510K), Hillside ($570K) and Kenilworth ($520K); mid-market $600K–$900K including Union Township ($609K), Roselle Park ($565K) and Springfield ($722K); and upper $900K–$1.5M including Cranford ($865K), Scotch Plains and Berkeley Heights, with Union County posting 341 single-family closings in June 2026, up 7.9% year over year, at a $750,000 median, and 42 townhouse and condominium sales at a $412.5K median. Kenilworth: a median home price of $602,000 as of March 2026 with an average sale price of $631,594 and an average 38 days listed, across nine houses listed from $539,900 to $1,249,000, and a trailing-twelve-month average sale price of $631,295 up approximately 7% (Homes.com); a May 2026 median list price of $624,000 at approximately $390 per square foot with a median 26 days on market (Movoto); and a median home value of $440,500 (BrightMLS-fed platform). Population 8,289 (2020), 2.06 square miles, approximately 75% owner-occupied and 22% rented; Warren G. Harding Elementary and David Brearley Middle/High School under a borough district; Garden State Parkway Exit 138 within the borough; NJ Transit bus route 113 to Port Authority; nearest Raritan Valley Line stations Cranford and Roselle Park approximately four to six minutes' drive; Galloping Hill Park and Golf Course laid out 1928 by A.W. Tillinghast. Cranford: a median sale price of $795,000 in April 2026 with 13 days on market and 65 homes sold, up from 44 a year earlier (Movoto); a single-family median sale price of $805,500 with townhouses at a $372,000 median and two-bedroom homes at $349,900, and recent sold examples ranging from a $292,000 Parkway Village sale to a $1,487,500 new-construction sale on Roosevelt Avenue, alongside a twelve-month median sale price of $770,000 up 3% with 11 active homes for sale and 0.60 months of supply (Homes.com data as reported by a regional brokerage); a median home price of approximately $750K–$795K with 13–15 days on market and +3.9% year-over-year appreciation per separate regional brokerage commentary; a median list price of $795,000 at $394 per square foot with 15 days on market in August 2026 (Movoto); and figures of $649,000 and $715,000 also in circulation. Recorded Union County property transfers for the week of August 4–10, 2026 included Cranford sales at $327,500 (806 sq ft, $406/sq ft), $590,000 (1,632 sq ft, $362/sq ft), $725,000 (1,712 sq ft, $423/sq ft) and $760,000 (1,328 sq ft, $572/sq ft). Sources discarded: a national listing platform returning "best and safest neighborhoods" lists for both Cranford and Kenilworth consisting of Manhattan and Jersey City district names including Tribeca, West Village, Gramercy Park, Paulus Hook, Journal Square and Weequahic — that content describes neither municipality; and a foreclosure-data aggregator reporting that "the percentage of properties for sale in the zip code is 132.00%" alongside Cranford median values ranging from $299,623 to $1,651,052. Household income, per-capita income, age, households-with-children, safety and crime data, and income-to-afford calculations available for both municipalities have been deliberately excluded, as we exclude such material for every community we cover. All figures are point-in-time and subject to change; medians, averages and value estimates are not appraisals, and town-level medians blend product types that should be comped separately. School attendance assignments, tax bills, assessments and transit schedules must be verified for any specific property. This is general information and market commentary, not legal, tax, or investment advice — verify all current details with the respective municipalities, school districts, NJ Transit and your own professionals before buying or selling.
Prodigy Real Estate is an innovative real estate company offering high-end video production, home valuation services, purchasing, and home sales. Serving New York and New Jersey.