
Anthony Licciardello | October 20, 2026
Carteret, NJ
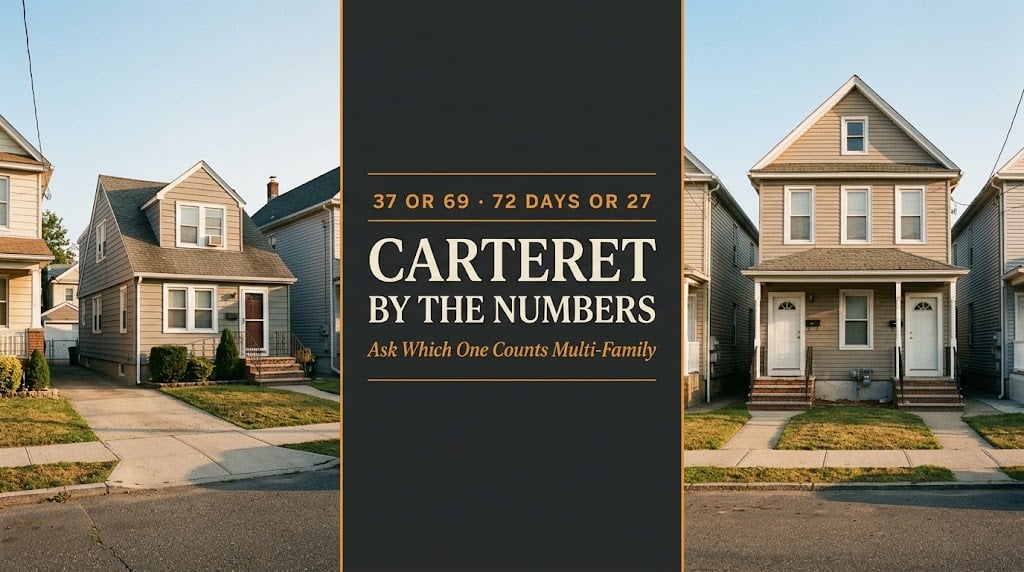
Two major platforms reported the same June in Carteret. One counted 37 sales, the other 69. One says homes take 72 days, the other says 27. A third is still publishing 2015 figures as though they were current. Underneath all of it sits a number that matters more than any of them: Carteret now trades at or above the New Jersey median — and the ferry has not carried a single passenger.
The published data on Carteret is in open disagreement. One platform: $595,000 median, 72 days, 37 June sales. Another, same month: $569,450 median, 27 days, 69 sales. A value index reads $439,650 — a different instrument entirely. And one national site still publishes April 2015 figures without saying so. But strip out the noise and the signal is unambiguous: at roughly $569,000 to $595,000, Carteret is trading at or above New Jersey's statewide median of about $587,553 — a borough that a decade ago was a $280,000 market. Which raises the question the ferry coverage never asks: how much of that premium is already in the price?
All figures below are point-in-time, from the sources named, measuring different things over different periods. None applies to a specific property. Verify comparable sales, tax bills, condition and flood status for any address you are considering.
Prices up 1.3% over the three months ending June, homes selling after an average 72 days against 72 a year earlier, 37 homes sold in June against 36. Adds that "hot homes" can sell about 5% above list and go pending in around 52 days.
Same June: a $569,450 median, properties selling after 27 days against 29 a year earlier, and 69 homes sold, up from 40. By September the same source reports a $579,000 median list price at $373 per square foot on a 33-day median.
Up 4.1% year over year. This is a value index, not a sale price — a model applied to the whole housing stock, including everything that did not sell. Useful for direction, useless for pricing an offer, and not comparable to the two figures above.
Property type and feed coverage, almost certainly. One platform may be counting single-family detached sales while the other includes condominiums, townhouses and multi-family; the two draw on different MLS feeds and public-record sources, and each reconstructs "Carteret" from its own geography. The gap of 86% on volume is not one of them being wrong — it is the two counting different things and both calling it June.
The 72-versus-27-day gap follows from the same cause and matters more to a seller. A wider net that includes slower-moving attached and multi-family product produces a longer average; a narrower one produces a shorter. Which is why neither number should ever be used on its own to set an expectation — and why "how long will my house take" is a question about your product type, not about Carteret.
Now the source we are discarding outright, because it is still live and it is eleven years stale. A national real-estate site's Carteret page reports a median listing price of $237,000 with homes selling "around the $280,000 range" at $146 per square foot, and cites listings growth "from 2014 to 2015" and a sale count for April 2015. It is publishing decade-old figures on a page that reads as current. We have discarded the same platform in four other municipalities — including for describing Woodbridge Township as located in Perth Amboy.
And one more, for the fifth time in this library. Asked for "the best and safest places to live in Carteret," a major listing platform returns Tribeca, West Village, Greenwich Village and Gramercy Park — Manhattan — alongside Jersey City and Newark neighbourhoods. Its price data may be sound; its geography is not, and we place no reliance on its neighbourhood output. The same page also cites a "Middlesex County R-1 School District," which is a data artefact rather than a real district name.
This is the finding that should reframe how anyone reads the waterfront coverage. Set the two credible Carteret medians — $569,450 and $595,000 — against New Jersey's statewide figures.
New Jersey median, August 2026 — $587,553, up 2.2%, at a median 43 days, with 3 months of supply
Carteret — $595,000 on one measure, above the state median
Carteret — $569,450 on another, just below it
One source notes Carteret's median sale price runs 39% above the national average
A decade ago, the same town was reported at roughly $237,000 list and $280,000 sale
The usual pitch on Carteret is that a Manhattan ferry is coming and prices have not caught up yet. The first half is true — the terminal is contracted and under construction, and no operator has yet been signed. The second half deserves scrutiny. A borough sitting at or above the state median is not an undiscovered market.
That does not mean the upside is gone. It means some meaningful portion of it may already be in the price, bought by people who read the same announcements you did. The honest question is not "will the ferry add value" but "how much of the expected value did I just pay for." Nobody can answer that precisely — but a buyer who has not asked it is not underwriting, they are hoping. The project detail is in our ferry terminal analysis.
Rahway — median around $525,000 as of early 2026 · a one-seat Northeast Corridor ride to New York Penn Station in roughly 45 minutes, with express service and a stop at Newark Liberty · a downtown ranked #2 in the nation for small-town arts scenes by USA Today, anchored by a restored 1928 movie palace on the National Register
Carteret — median $569,450 to $595,000 · no train station · a waterfront under construction
Carteret is currently trading above a city with a one-seat commute to Penn Station and a nationally ranked arts district. That is not an argument against Carteret — the two places suit different buyers, and a Goethals-adjacent borough with a marina and a ferry terminal under construction is selling something Rahway cannot. But if the pitch you have been given is that Carteret is the cheap way into this corridor, the comparison one town north says otherwise. Our complete Rahway guide sets out that market in full.
Two figures do agree across sources, and they are the ones to plan around. The September list median of $579,000 at $373 per square foot tells you what sellers currently believe, and it sits close to both June sale medians — which suggests the gap between asking and achieving in Carteret is currently narrow. And "hot homes" going pending in around 52 days at about 5% above list tells you the top of the market moves while the rest waits. That is a two-speed market, and which speed you are in depends on preparation more than on price.
One platform will tell your buyer your house should take 27 days. Another will tell them 72. Both are describing your town.
In a market where the published pace differs by a factor of 2.7 and the transaction count by 86%, whichever number your buyer happens to have read becomes their negotiating anchor. The answer is not to argue with a platform — it is to arrive with matched closed sales of your own product type that make the question irrelevant. We comp by type and condition, price against the narrow list-to-sale gap this market is currently running, and market the waterfront investment properly rather than vaguely. Backed by the New York metro buyer pool that reaches Carteret across the Outerbridge.
One platform publishes migration figures for Carteret, and they are worth reading — with one caveat applied throughout. The publisher states plainly that the data "does not reflect actual moves" — it is drawn from a sample of users searching, across more than 100 metro areas. It measures interest, not relocation.
77% of Carteret homebuyers looked to stay within the metropolitan area
23% searched to move out
Nationally, 3% of homebuyers searched to move into Carteret from outside the metro
The metro searching into Carteret most was Seattle, followed by Kalamazoo and Bloomington
The destination Carteret searchers looked at most was Miami, then Philadelphia and Orlando
77% staying within the metro is the number a seller should hold. It says the Carteret buyer pool is overwhelmingly regional — people already in this area, moving within it. Which means your house is competing against other houses in this corridor, not against a national field, and it should be priced and marketed against local alternatives.
The Seattle and Miami figures we would not build anything on. Search behaviour in a sampled dataset produces odd pairings, and "Seattle searched into Carteret more than any other metro" is a statement about a sample, not about who is buying houses here. Reporting it and then declining to draw a conclusion from it is the correct treatment.
What is missing from that dataset is the pool that actually matters here, and it does not show up as a metro search. Carteret sits on the Arthur Kill directly across from Staten Island, and households moving across that water are moving within the New York metro — they are inside the 77%, invisible as a separate category. For a corridor where the cross-bridge move is the dominant story, that is the most consequential thing the migration data cannot tell you. The mechanics of that move are in our Staten Island to New Jersey guide.
The 37-versus-69 gap is almost certainly a product-mix gap. Get closed sales of your type — detached, attached, multi-family — rather than a town median that blends them. Then ask honestly how much of the waterfront expectation is already in the asking price, given the borough already trades at or above the state median.
A $579,000 September list median sitting close to June sale medians of $569,450 and $595,000 means this market is not absorbing aspirational pricing. And "hot homes" going pending in about 52 days at roughly 5% above list shows where prepared inventory lands. The difference between those two outcomes is preparation, not luck.
This is a working industrial waterfront with a brownfield history — the ferry terminal itself sits on a former DuPont site. Get the flood determination, get an insurance quote in your own name, and put environmental questions to your attorney. The same applies directly across the water in Sewaren. You evaluate the address, not the borough.
Completion is put at December 2027 or early 2028, and no ferry operator has been signed. Whatever you buy here, you are driving, bussing or getting to a train station for at least the next eighteen months. Test that trip at your real hour before you commit to it.
The overall read on Carteret, stated plainly. It is a genuine market with real volume, trading at or around the New Jersey median, in a borough undergoing a serious and contracted waterfront transformation — and it is no longer the bargain the older data suggests. The opportunity here is not that nobody has noticed. It is that the platforms cannot agree on what is happening, and in that gap a buyer or seller working from their own matched comps has a real advantage over one working from a headline.
When two platforms disagree this badly on volume, ask which one counts multi-family — because in Carteret that is not a rounding error. A borough with a working industrial history and a dense older street grid carries a meaningful share of two- and three-family houses, and those trade on different arithmetic entirely: rental income, financing terms and investor demand rather than kitchens and school runs. A platform including them in "homes sold" produces a higher count and a longer average days-on-market; one excluding them produces the opposite. If you are buying a single-family house, a median that includes multi-family is describing a different market than the one you are in — and if you are buying multi-family, a median that excludes it is worse than useless. One question to your agent, before any number means anything.
"Two platforms reported the same June in Carteret. One says thirty-seven homes sold, the other says sixty-nine. One says seventy-two days, the other says twenty-seven. That is eighty-six percent apart on volume and almost three times apart on pace, in the same town, in the same month. It's product mix — somebody's counting multi-family and somebody isn't. But here's the part the ferry coverage never gets to. Carteret's trading somewhere around five-seventy to five-ninety-five. The New Jersey median is five-eighty-seven. So this isn't an undiscovered town anymore — a decade ago it was a two-eighty market. The ferry hasn't carried a passenger and the premium's already partly in there. And here's the one that should stop you: Rahway's around five-twenty-five. One-seat ride to Penn in forty-five minutes, number two arts district in the country. Carteret's trading above that with no station at all. That doesn't mean don't buy. It means know what you're paying for before you pay it."
— Anthony Licciardello, Broker, The Prodigy Team

Carteret's buyer pool is overwhelmingly regional, and a large part of it crosses the Arthur Kill from Staten Island — which is precisely the market I work: I'm Anthony Licciardello, Broker of The Prodigy Team, dual-licensed in New York and New Jersey, a former Director of Community Affairs in the Bloomberg Administration, and a leading broker for cross-border New York–New Jersey transactions.
Anthony Licciardello · Broker, The Prodigy Team · 718-873-7345
We comp by product type — and tell you honestly how much of the ferry is already in the price.
What do homes cost in Carteret, NJ?
Two credible sale medians sit close together: $595,000 over the three months ending June 2026, up 1.3%, and $569,450 for June 2026. A September list median of $579,000 at $373 per square foot sits between them. A separate value index reads $439,650, up 4.1% — that is a model applied to the whole housing stock, not a sale price, and is not comparable. Ignore any Carteret page quoting a median near $237,000 or $280,000; those are 2015 figures still being served as current.
How fast do homes sell in Carteret?
Sources disagree by a factor of 2.7 on the same month. One reports an average 72 days with 37 homes sold in June; another reports 27 days with 69 sold in the same June. The gap is almost certainly product mix — whether attached and multi-family sales are counted. Both agree the top of the market is faster: "hot homes" go pending in around 52 days at about 5% above list. Ask which property types a quoted figure includes before you use it.
Is Carteret still a cheap place to buy?
No — and this is the most important correction to make. At roughly $569,000 to $595,000, Carteret trades at or above New Jersey's statewide median of about $587,553, and one source notes its median sale price runs 39% above the national average. A decade ago the same borough was reported at roughly $237,000 list and $280,000 sale. The ferry terminal is contracted and under construction with no operator yet signed — which means some portion of that expected premium may already be in today's prices. The question is not whether the ferry adds value, but how much of it you are paying for now.
Who is buying in Carteret?
Overwhelmingly regional. Migration data for January to March 2026 shows 77% of Carteret homebuyers looking to stay within the metropolitan area and 23% searching to move out, with only 3% of homebuyers nationally searching into Carteret from outside the metro. That publisher states the data does not reflect actual moves — it measures search behaviour. Note also that households crossing the Arthur Kill from Staten Island are moving within the New York metro and sit inside that 77%, invisible as a separate category — which for this corridor is the most consequential thing the data cannot show.
The Arthur Kill Ladder — Three Markets, Eight Miles
Moving to Linden — Fewer Than Half the Homes Are Houses
Moving to Carteret — The Complete Guide
Carteret — A $48M Ferry Terminal and No Operator Signed
Sewaren — Woodbridge Is Rebuilding Its Cheapest Waterfront
Staten Island to New Jersey — The Three Questions and Two Rules
Buying in Woodbridge — Four Sources, Four Prices
Everything Being Built in Woodbridge Right Now
Rahway — The Complete Buying and Selling Guide
Rahway Neighborhoods — A Guide to the City's Sections
Figures as of publication, from the sources noted, measuring different quantities over different periods, and subject to change. Carteret sale data: per Redfin, over the three months ending June 2026 Carteret home prices were up 1.3% year over year selling for a median price of $595,000, homes sold after an average 72 days on market compared with 72 days a year earlier, and 37 homes were sold in June 2026 up from 36 a year earlier, with "hot homes" able to sell for about 5% above list price and go pending in around 52 days; the same source notes Carteret's median sale price is 39% higher than the national average and that overall cost of living is 18% higher than the national average. Per Movoto, Carteret homes sold for a median price of $569,450 in June 2026, with properties selling after an average 27 days on market compared with 29 days a year earlier, and 69 homes sold in June 2026 up from 40 a year earlier; the same source reports that in September 2026 Carteret homes were listed at a median price of $579,000 at a median $373 per square foot, spending a median 33 days on market. These two sources differ by approximately 86% on June transaction count and by a factor of roughly 2.7 on days on market for the same period; the most likely explanation is differing property-type inclusion and MLS feed coverage, and neither figure should be used alone. Per Zillow, the typical home value in Carteret is $439,650, up 4.1% over the past year — the Zillow Home Value Index is a model measuring monthly changes in property-level estimates across the whole housing stock and is not a transaction price; it must not be compared against sale medians. New Jersey benchmarks: per Redfin, in August 2026 New Jersey home prices were up 2.2% year over year selling for a median price of $587,553, with 7,421 homes sold in August, a median 43 days on market, 32,750 homes for sale up 8.8% year over year, and an average 3 months of supply. Migration data per Redfin: in January–March 2026, 23% of Carteret homebuyers searched to move out of Carteret while 77% looked to stay within the metropolitan area; across the nation 3% of homebuyers searched to move into Carteret from outside metros; Seattle homebuyers searched to move into Carteret more than any other metro, followed by Kalamazoo and Bloomington; Miami was the most popular destination among Carteret homebuyers, followed by Philadelphia and Orlando. Redfin states expressly that this data does not reflect actual moves and is based on a sample of about two million users who searched for homes across more than 100 metro areas; it is reported here as search behaviour only and no conclusion about actual relocation is drawn from it. Sources discarded: a national real-estate site's Carteret page publishes a median listing price of $237,000 with homes selling "around the $280,000 range" at $146 per square foot, citing listings growth "from 2014 to 2015" and a sale count for April 2015 — these are approximately eleven-year-old figures presented on a page that reads as current, and no reliance is placed on them; the same platform has been discarded in four other municipalities in this library, including for describing Woodbridge Township as located in Perth Amboy. Separately, a major listing platform's response to "the best and safest places to live in Carteret" returns Tribeca, West Village, Greenwich Village, Gramercy Park and other Manhattan, Jersey City and Newark neighbourhoods rather than Carteret ones, and the same page cites a "Middlesex County R-1 School District" which is a data artefact rather than a real district name; that platform's sale and listing figures are cited above, but no reliance is placed on its neighbourhood or school output. Rahway comparison figures are from our own complete Rahway guide, which reports a median sale price of around $525,000 as of early 2026, a one-seat Northeast Corridor ride to New York Penn Station of roughly 45 minutes with faster express service and access to Newark Liberty, and a downtown named the #2 small-town arts scene in the country by USA Today, anchored by the Union County Performing Arts Center whose 1,300-seat Main Stage occupies a restored 1928 movie palace listed on the National Register; that guide notes figures vary by source and by specific home and neighbourhood. School performance ratings, household income, age and household composition data available from the sources consulted have been deliberately excluded, as we exclude such material for every community we cover. Ferry terminal detail is set out with its sources in our separate Carteret ferry terminal analysis; no prediction is made here about ferry timing, operation, or its effect on property values. Medians, averages and value indexes are not appraisals and describe populations of transactions or modelled values rather than any individual property. Comparable sales, property type, flood determinations, insurance costs, environmental history, tax bills and condition must be verified for any specific property. This is general information and market commentary, not legal, environmental, tax or investment advice.
Prodigy Real Estate is an innovative real estate company offering high-end video production, home valuation services, purchasing, and home sales. Serving New York and New Jersey.